·
Playlists
·
How We Grew a Spotify Playlist 1,300% With Ads: A Case Study
We ran a real Spotify playlist campaign for 28 days: 1,300% follower growth, 18,000+ monthly streams, and what actually drove it. Here's the breakdown.

MeansMGMT
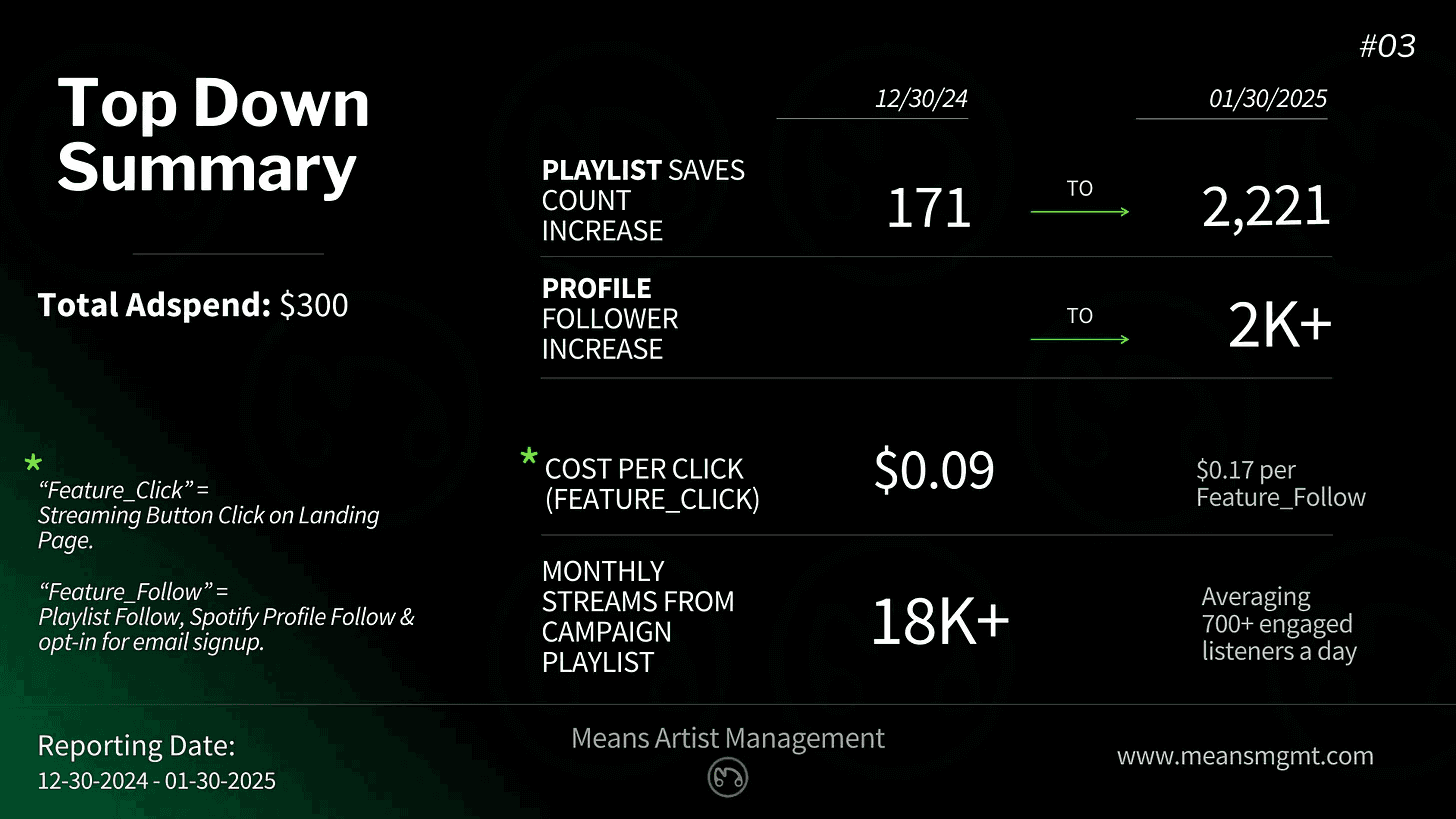
We grew a Spotify playlist about 1,300% in 28 days. Targeted ads, 115K+ engagements, and a 98% click-to-service rate turned into 18,000+ monthly streams.
Playlist pitching gets a lot of hate, and most of it is earned. Buy a slot on someone's playlist, the streams show up, and the day you stop paying they vanish. So when we ran a real playlist campaign end to end, I wanted to see what happens when you build the audience with targeted ads instead of renting a placement.
The run covered 28 days, late December into January, on a curated playlist group. The goal was an engaged audience that keeps listening after the ads stop.
The follower growth
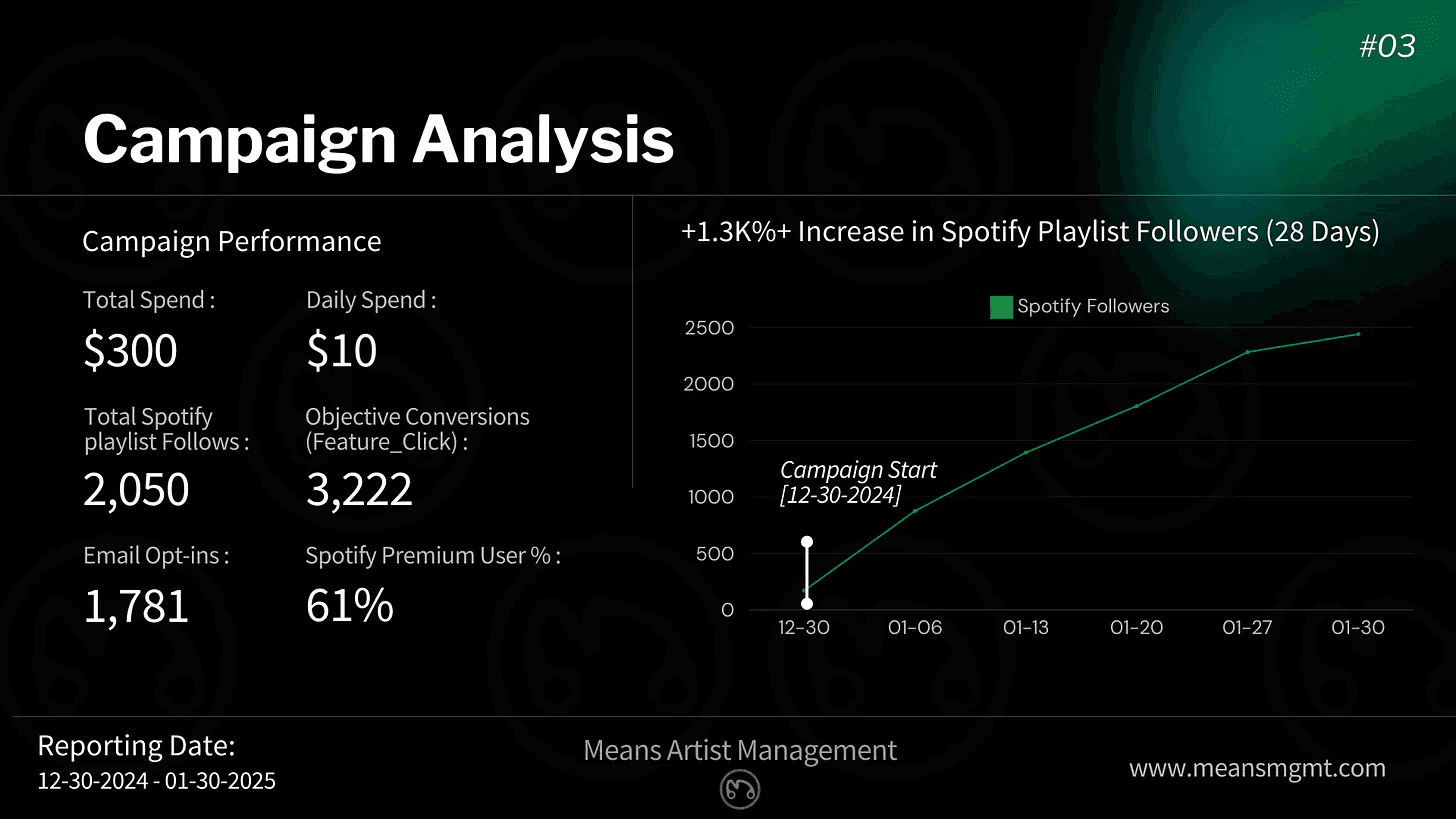
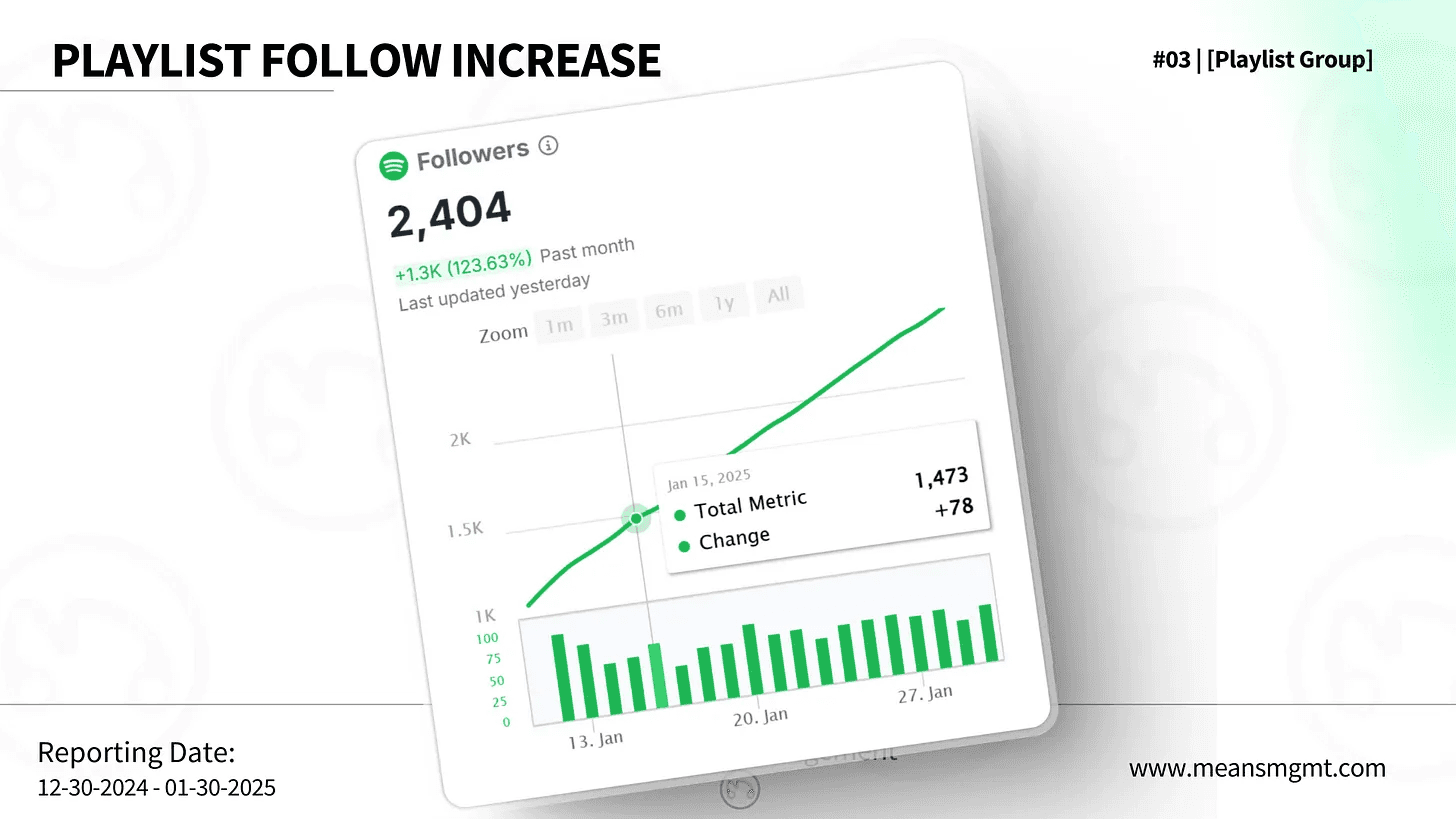
Playlist followers grew about 1,300% over the 28 days. The playlist started from a small base, added more than 2,000 followers to hit 2,050 by the end of the reporting window, and sits at 2,404 as I write this. Growth that keeps ticking up after the campaign ends is the tell that you built something real, not a spike that collapses the week you turn spend off.
Engagement, not just follows
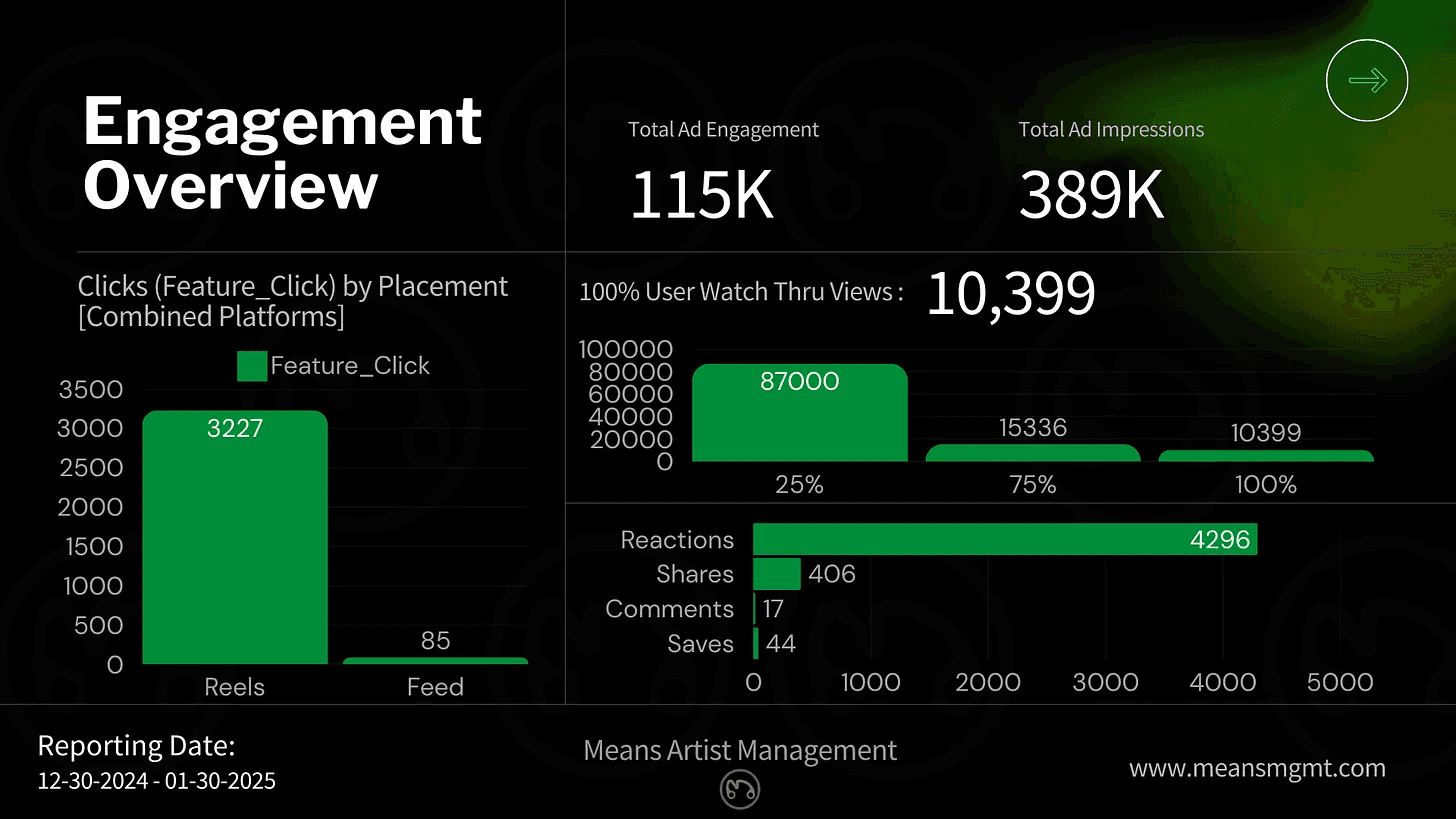
Followers were never the whole point. Across platforms the campaign pulled 115,000 total engagements against 389,000 impressions. Reels did most of the heavy lifting, driving 3,227 clicks. This run backed up what we see across campaigns: short-form video drives discovery.
More than 10,000 people watched the ad all the way through. The ads also drew over 4,200 reactions, hundreds of shares and saves, and real comments from listeners reacting to the music.
The landing page
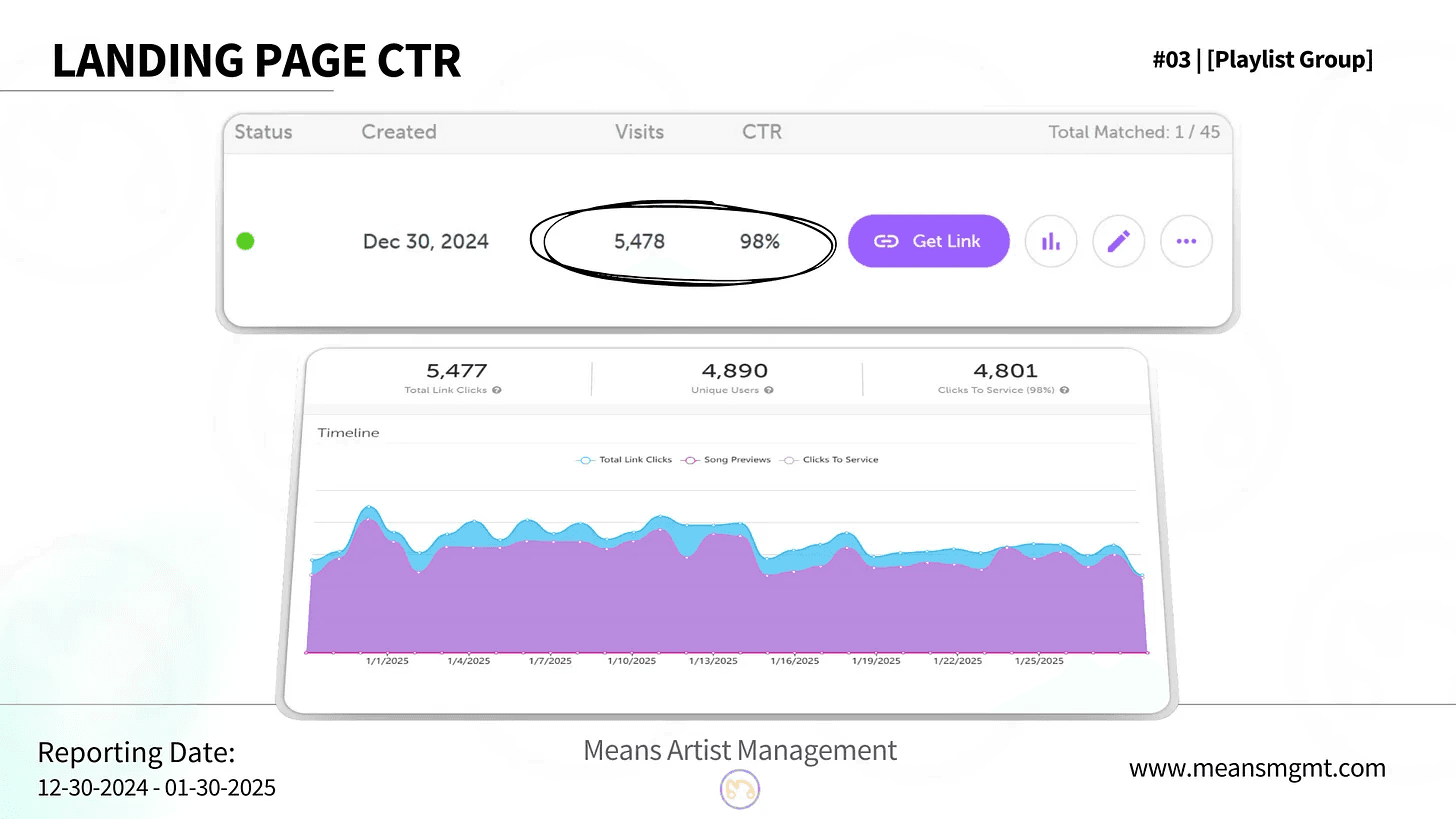
The landing page is where I'd normally expect the story to get shaky, and it didn't. On the smart link, about 98% of the people who hit the page clicked through to Spotify. That's a click-to-service rate, the share of visitors who took the action we wanted. It is not an ad click-through rate, which normally runs in the low single digits. Across 5,478 visits on one landing page configuration, that 98% held. The traffic was engaged listeners walking straight onto the playlist.
What it actually produced
The playlist is now generating over 18,000 monthly streams from the campaign alone, averaging 700-plus engaged listeners a day. That's the number I'd hang the case on, because it's downstream of everything else and it keeps compounding.
I won't oversell it. We ran targeted ads, leaned on the format that was working, and pointed high-intent traffic at one clear destination. On a modest budget that was enough to move a playlist from a standing start to a real, engaged following. Ad spend is rented reach, and the followers stay after it ends.
FAQ
Questions we get
If you have a release coming, start with two quick questions, about three minutes in total, and we’ll scope your campaign. Want the numbers first? The benchmarks report is free.