

Cutting Tier 2 on reflex removes the exact markets IFPI, Spotify, Luminate, and MIDiA all point to as where the growth is.
Asking us to exclude Tier 2 and Tier 3 markets from a streaming campaign is one of the most common requests we get, usually the moment an unfamiliar city shows up in Spotify for Artists. Part one covered the arithmetic behind small-artist maps. Part two covered the placement market that seeds geography before advertising even starts. This one takes on the commercial question underneath both: when you target Tier 2 markets in music marketing, do you actually get anything back?
Tier 2 presence is the baseline at scale
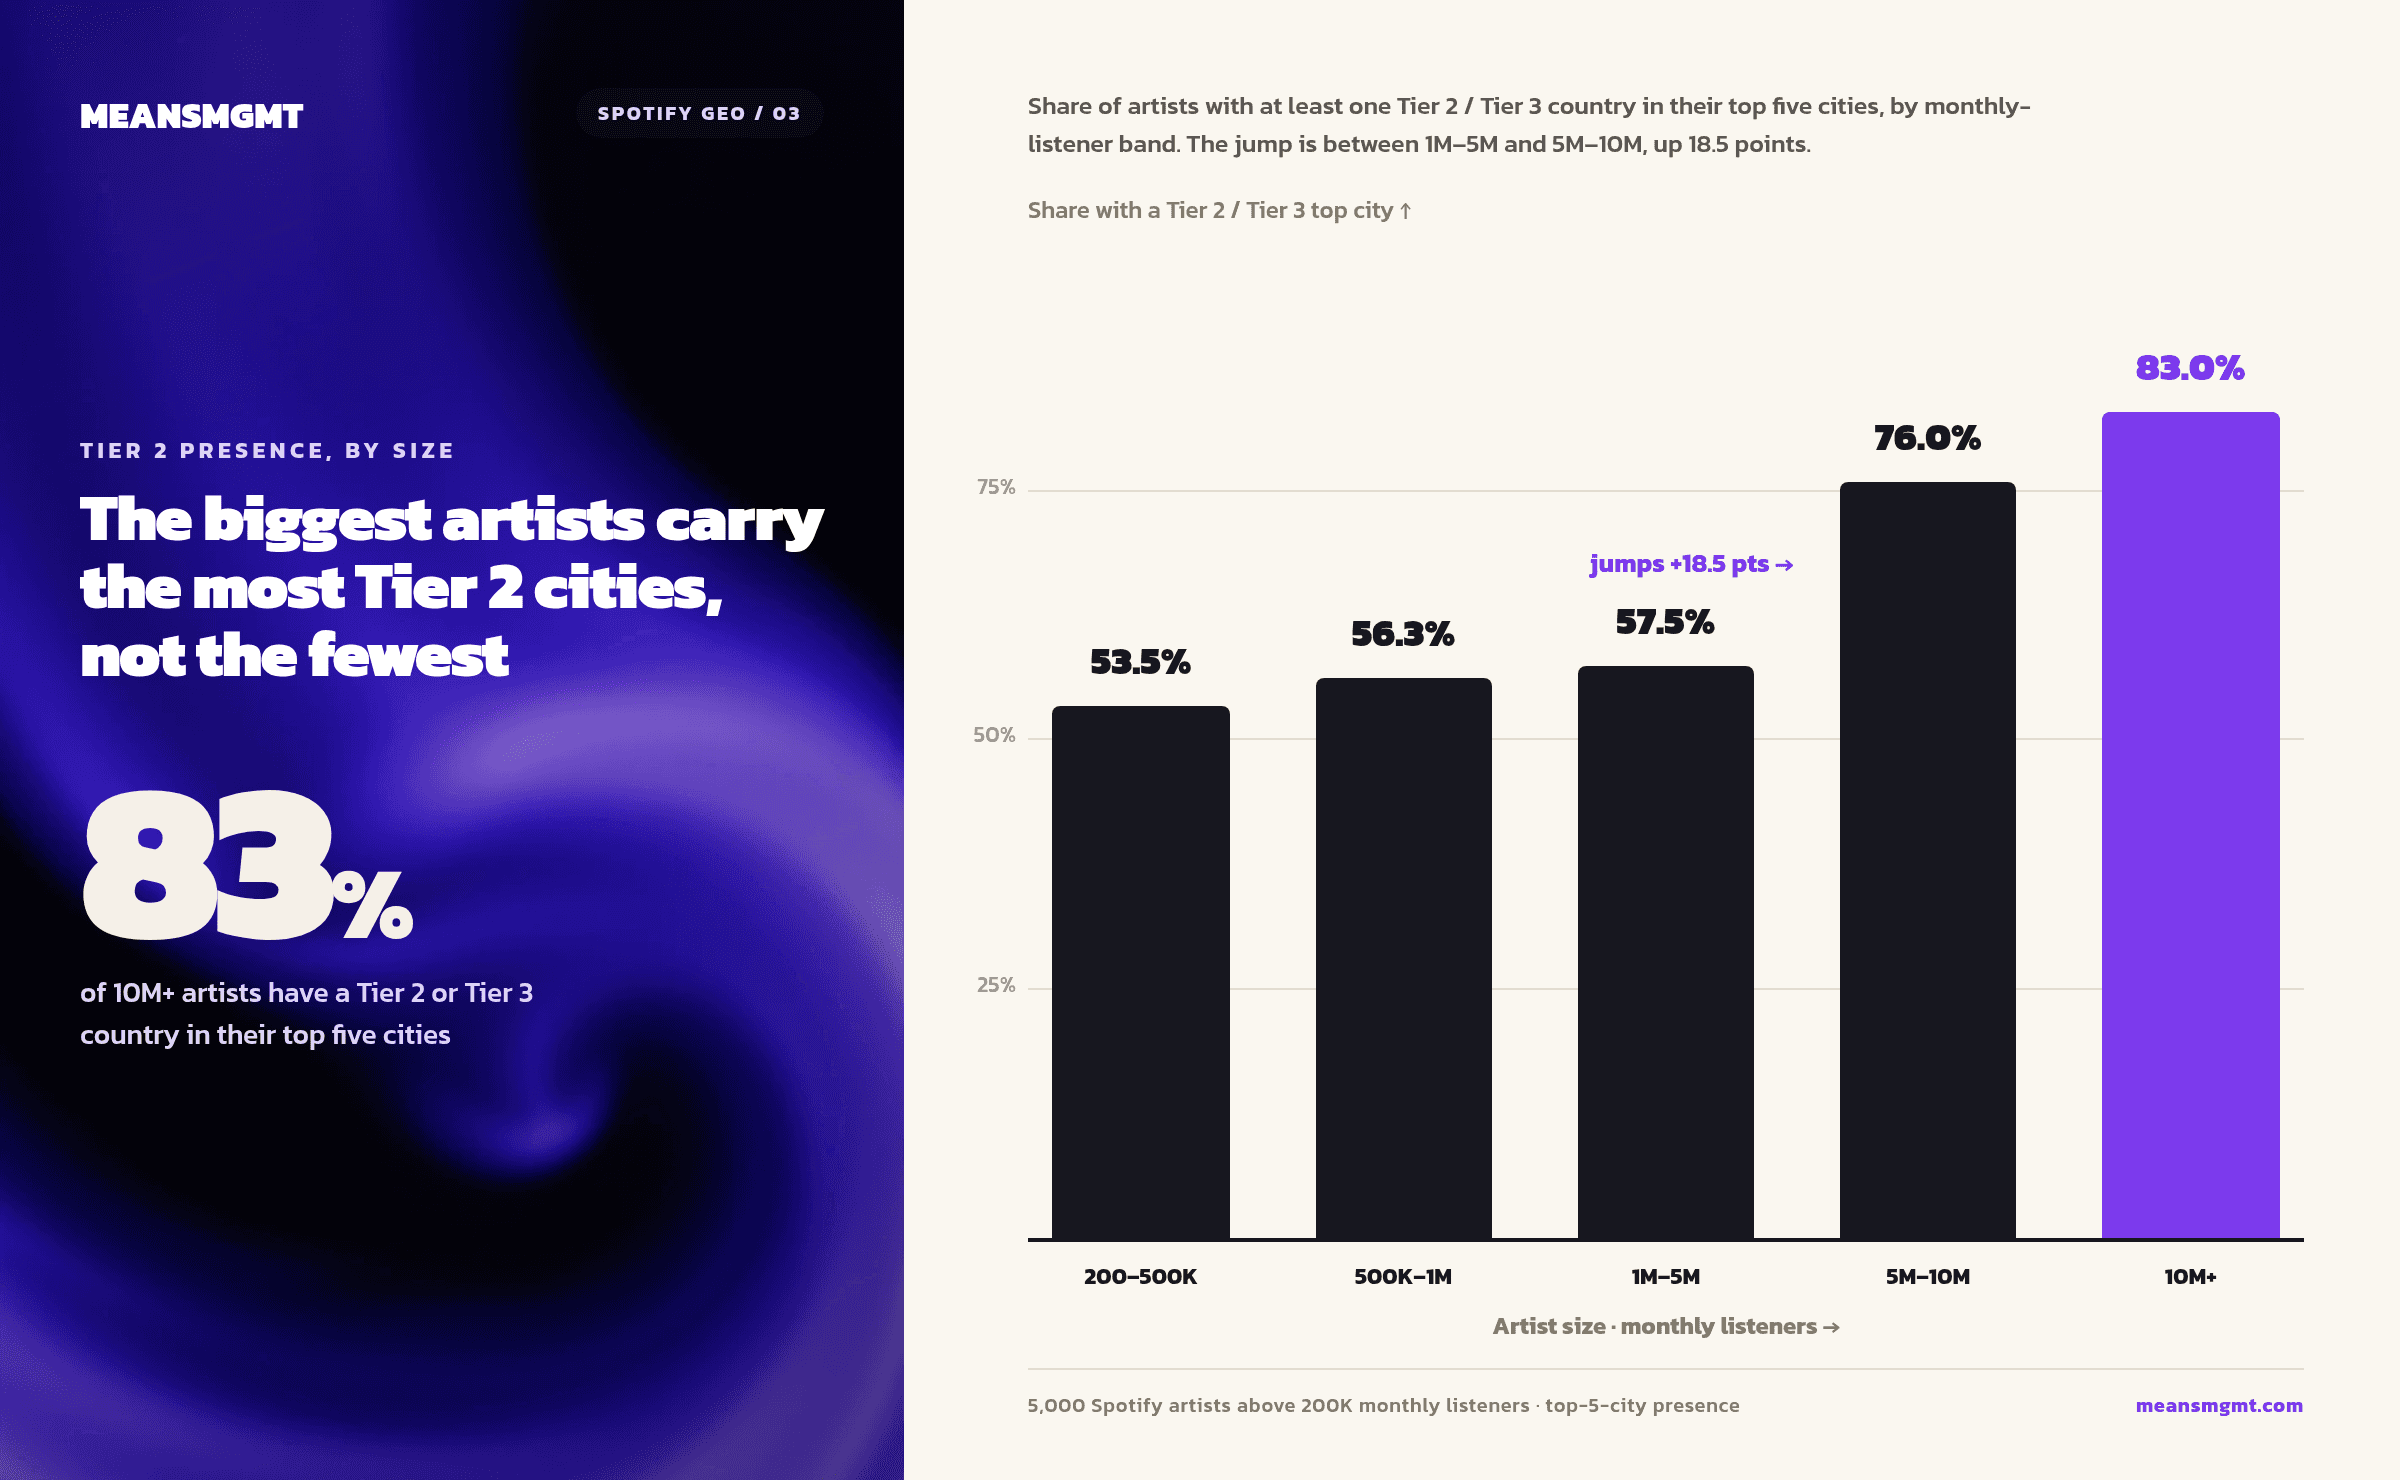
We pulled top-five city lists for 5,000 Spotify artists above 200,000 monthly listeners. 69% carried at least one Tier 2 or Tier 3 country in their top five cities. Above 10 million monthly listeners, that rose to 83%. Presence scales up with artist size, not down.
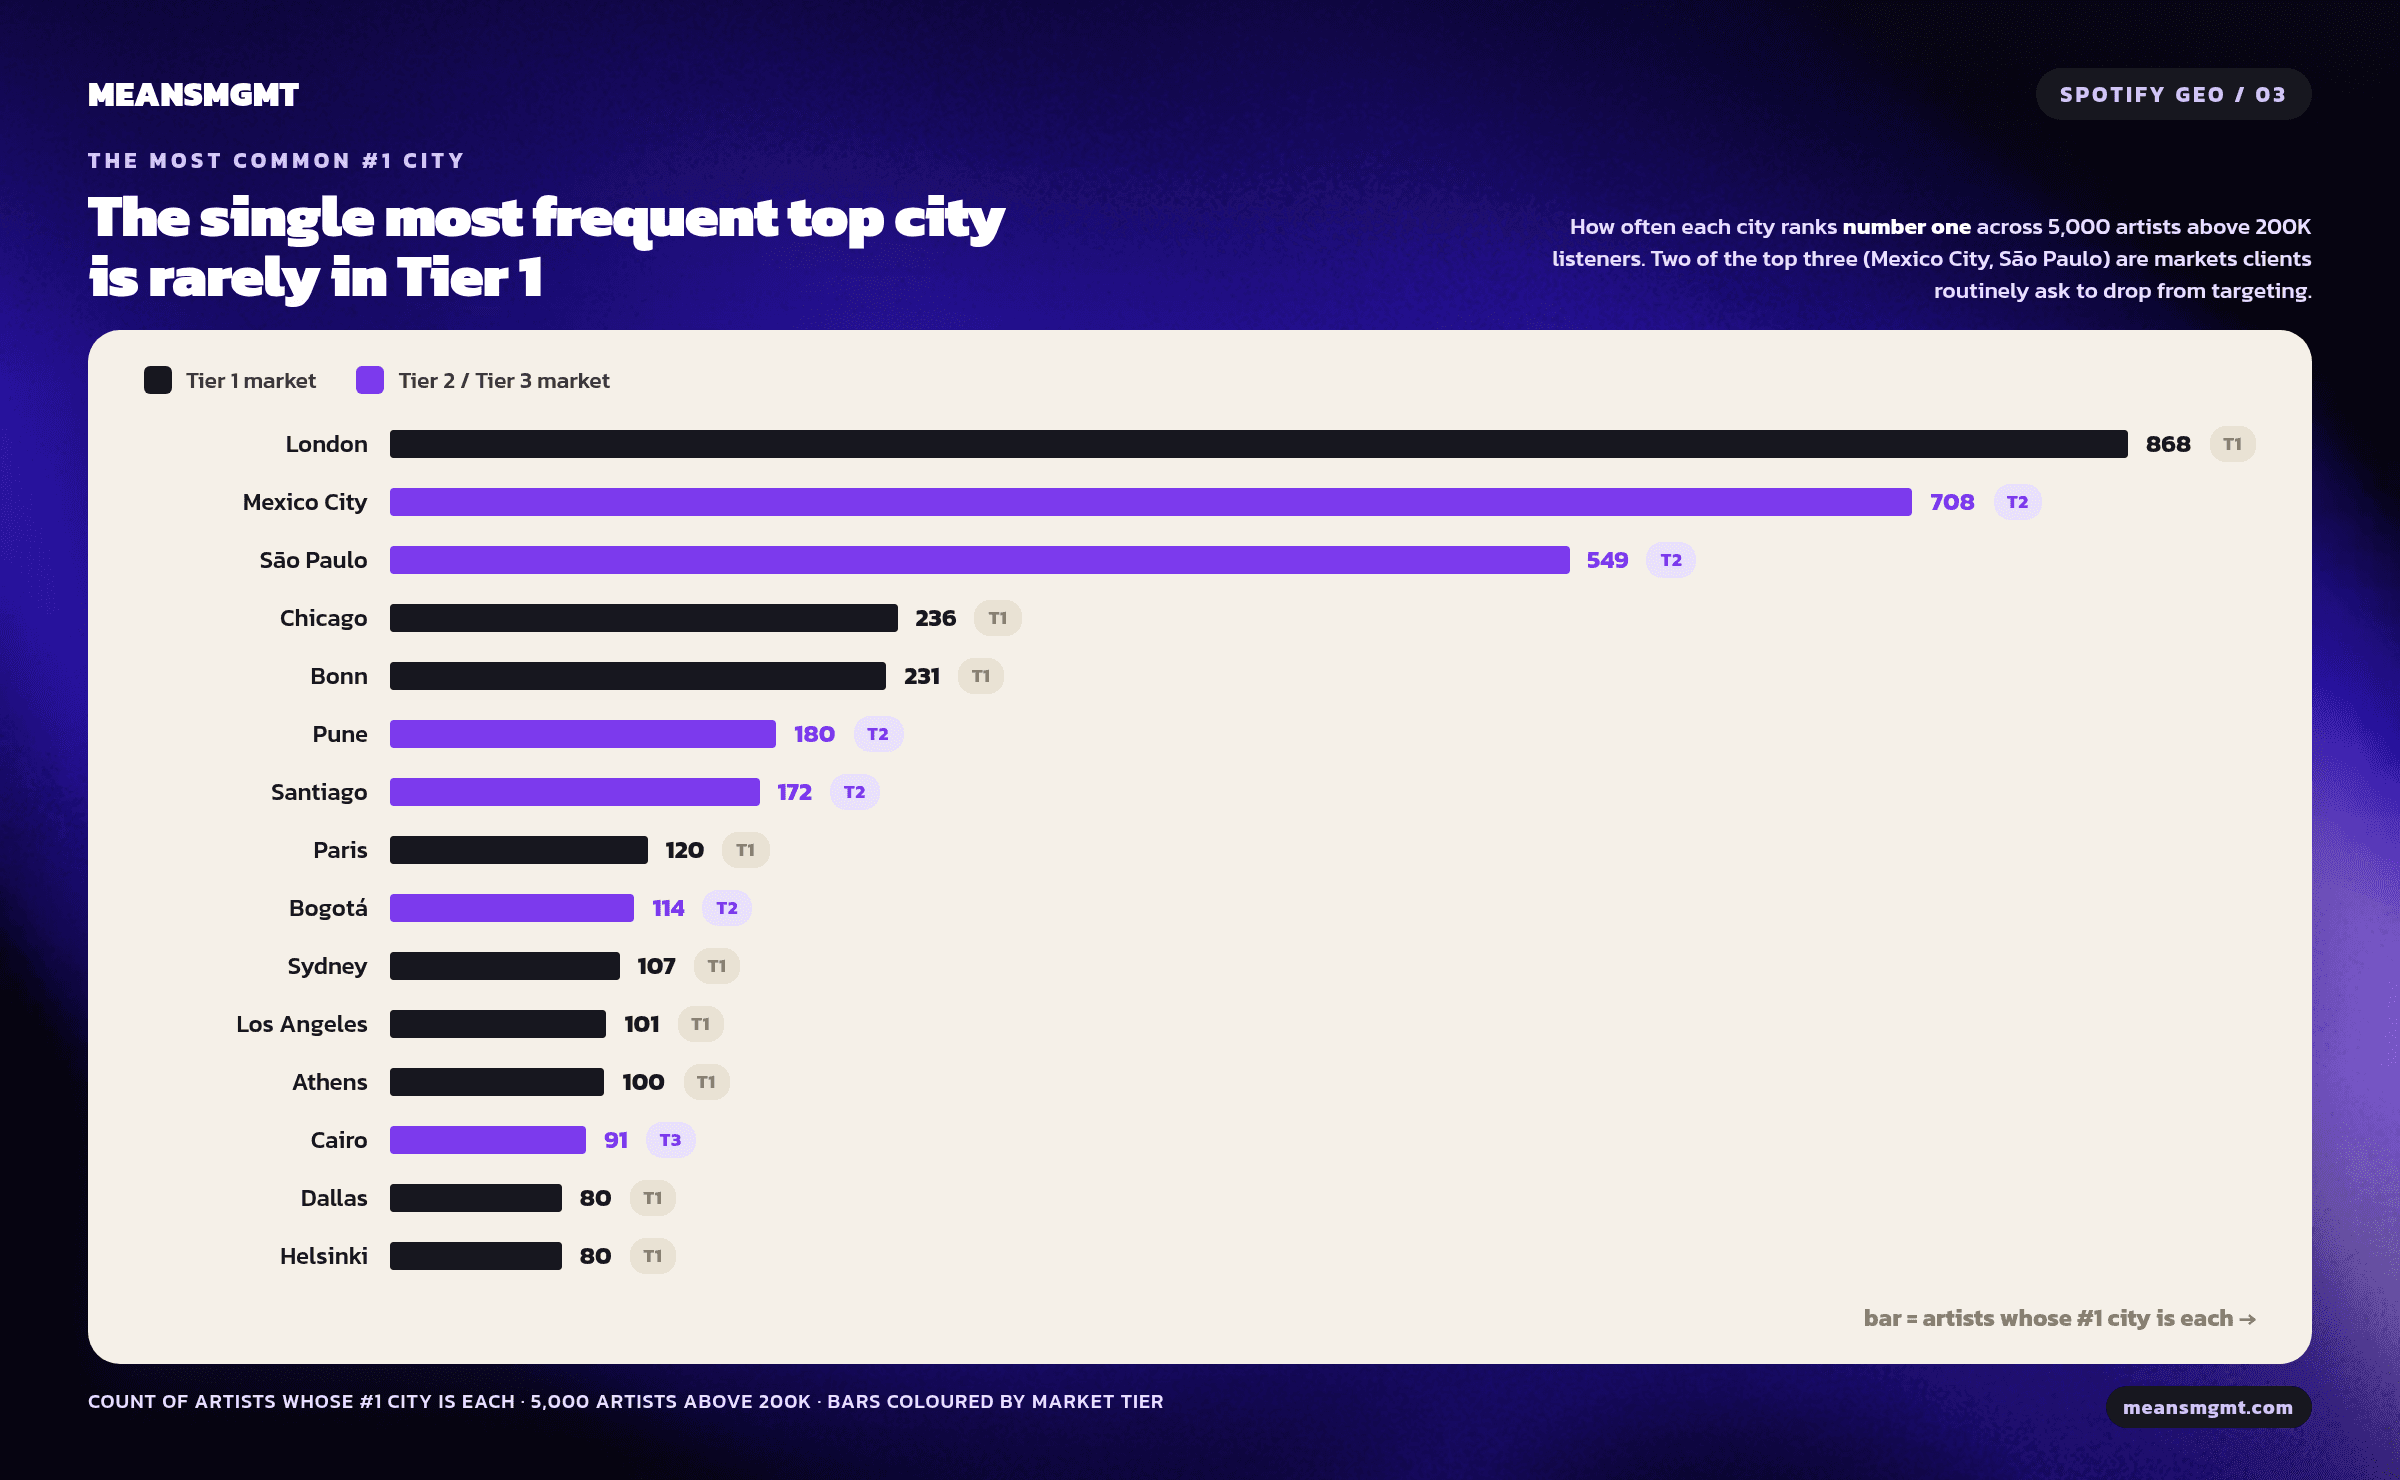
And it goes past presence. For 53% of those artists, the single highest-ranked city is a Tier 2 or Tier 3 market. The three most frequent number-one cities across the sample were London (868), Mexico City (708), and São Paulo (549). Two of the top three are markets clients routinely ask us to drop.
One caveat on all of this. These are top-city presence figures, the footprint you see on a Spotify for Artists screen, not country-by-country audience share, and we're not presenting them as such. As a footprint signal the read is consistent: established artists have globally distributed maps, and cutting these markets from a growth campaign targets an audience shape the platform's biggest artists don't have.
Where music is actually growing in 2026
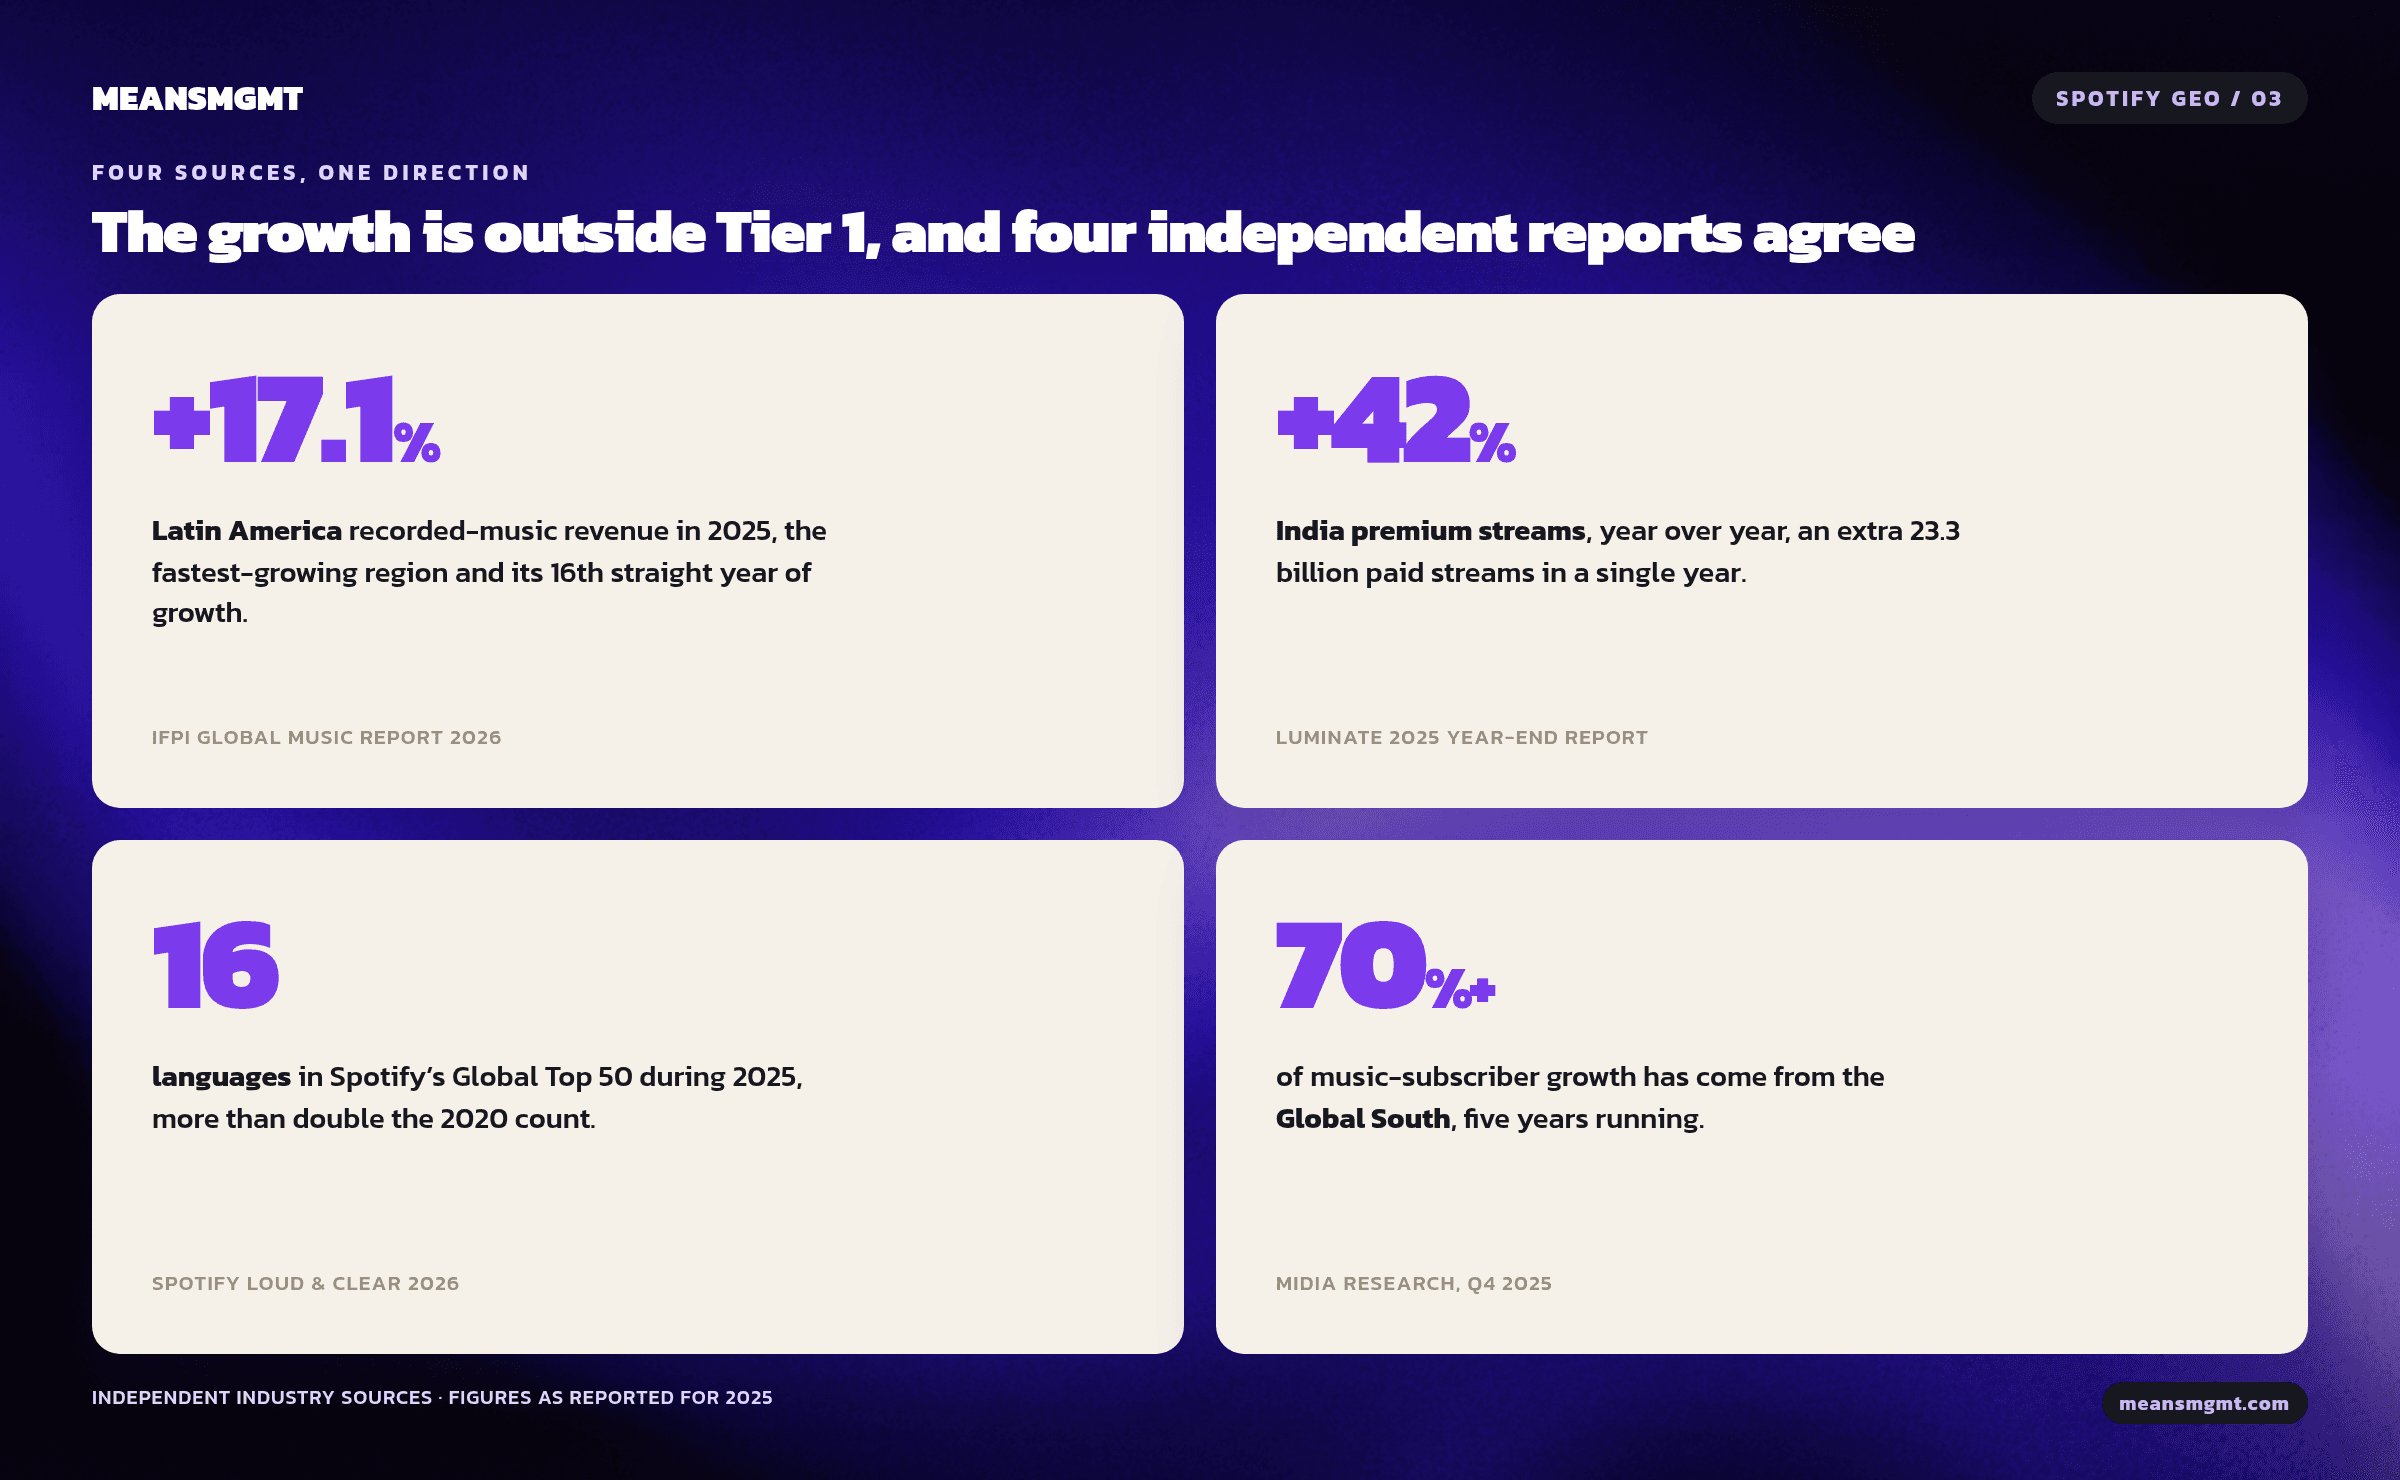
Four independent sources point the same way.
IFPI's Global Music Report 2026 puts Latin America up 17.1% in 2025, the fastest-growing region in the world and its sixteenth straight year of growth. Spotify's Loud & Clear 2026 counted 16 languages in the Global Top 50, more than double the 2020 figure, and reported that two years after debuting, artists typically earn more than half their royalties outside their home country. Luminate's 2025 year-end report has India's premium streams up 42% year over year, an extra 23.3 billion paid streams in a single year. MIDiA Research finds the Global South has driven more than 70% of music subscriber growth for five straight years, with Brazil driving Latin America's record net additions.
Luminate also reports that four countries account for 48.9% of global premium streams: the US, Mexico, Brazil, and Germany. Two of the four markets where paid streaming is already concentrated are the ones clients most often ask to remove.
These markets originate formats
The subscriber curve is the weaker argument. The stronger one is the track record.
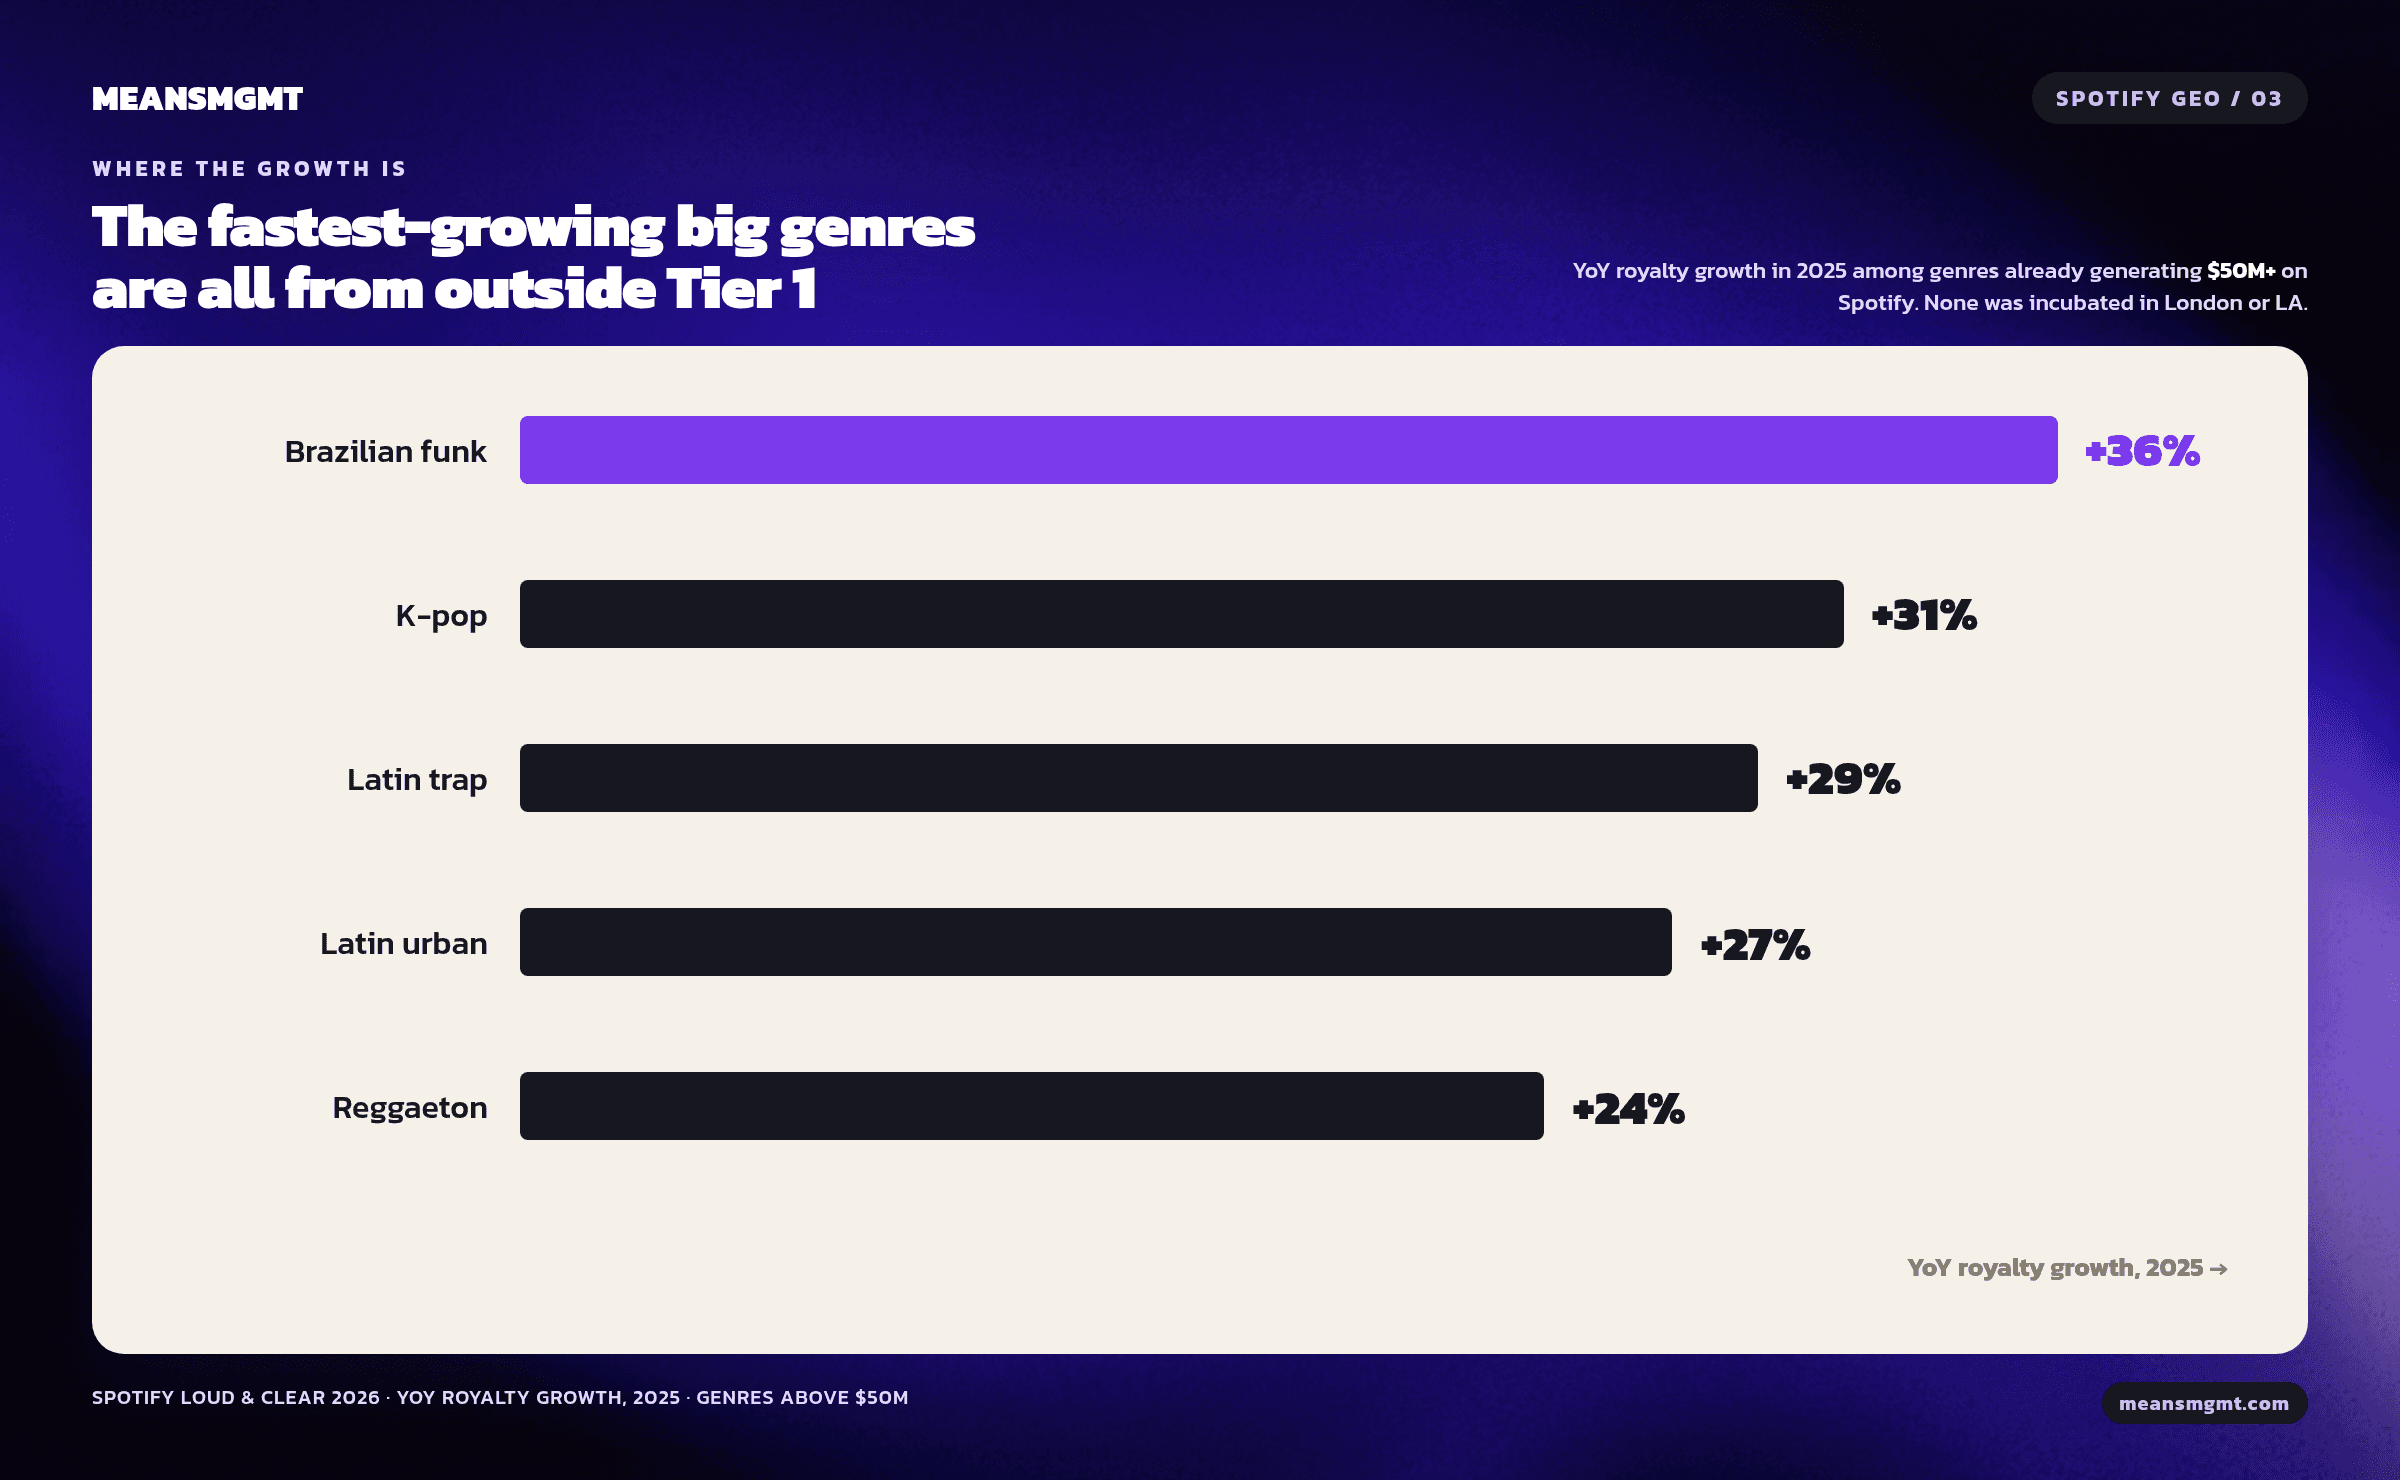
Reggaeton, afrobeats, amapiano, Brazilian funk, corridos tumbados: each followed the same path, a regional scene in a market the industry priced as cheap, then a global format. Spotify's own royalty data shows it continuing. Among genres already generating $50 million+ on the platform, the fastest-growing in 2025 were Brazilian funk (+36%), K-pop (+31%), Latin trap (+29%), Latin urban (+27%), and reggaeton (+24%). None was incubated in London or Los Angeles.
Our own city-level data offers a partial why. Measuring genre diversity across hub cities, Mexico City and São Paulo land inside the same narrow band as London and Chicago, a gap small enough it wouldn't change a targeting call. Jakarta imports nearly everything it listens to: only 5% of its listening sits in home-region genres against 46% cross-regional, on a smaller sample than the majors (151 city rows against London's 1,697). These are markets that listen broadly and adopt early.
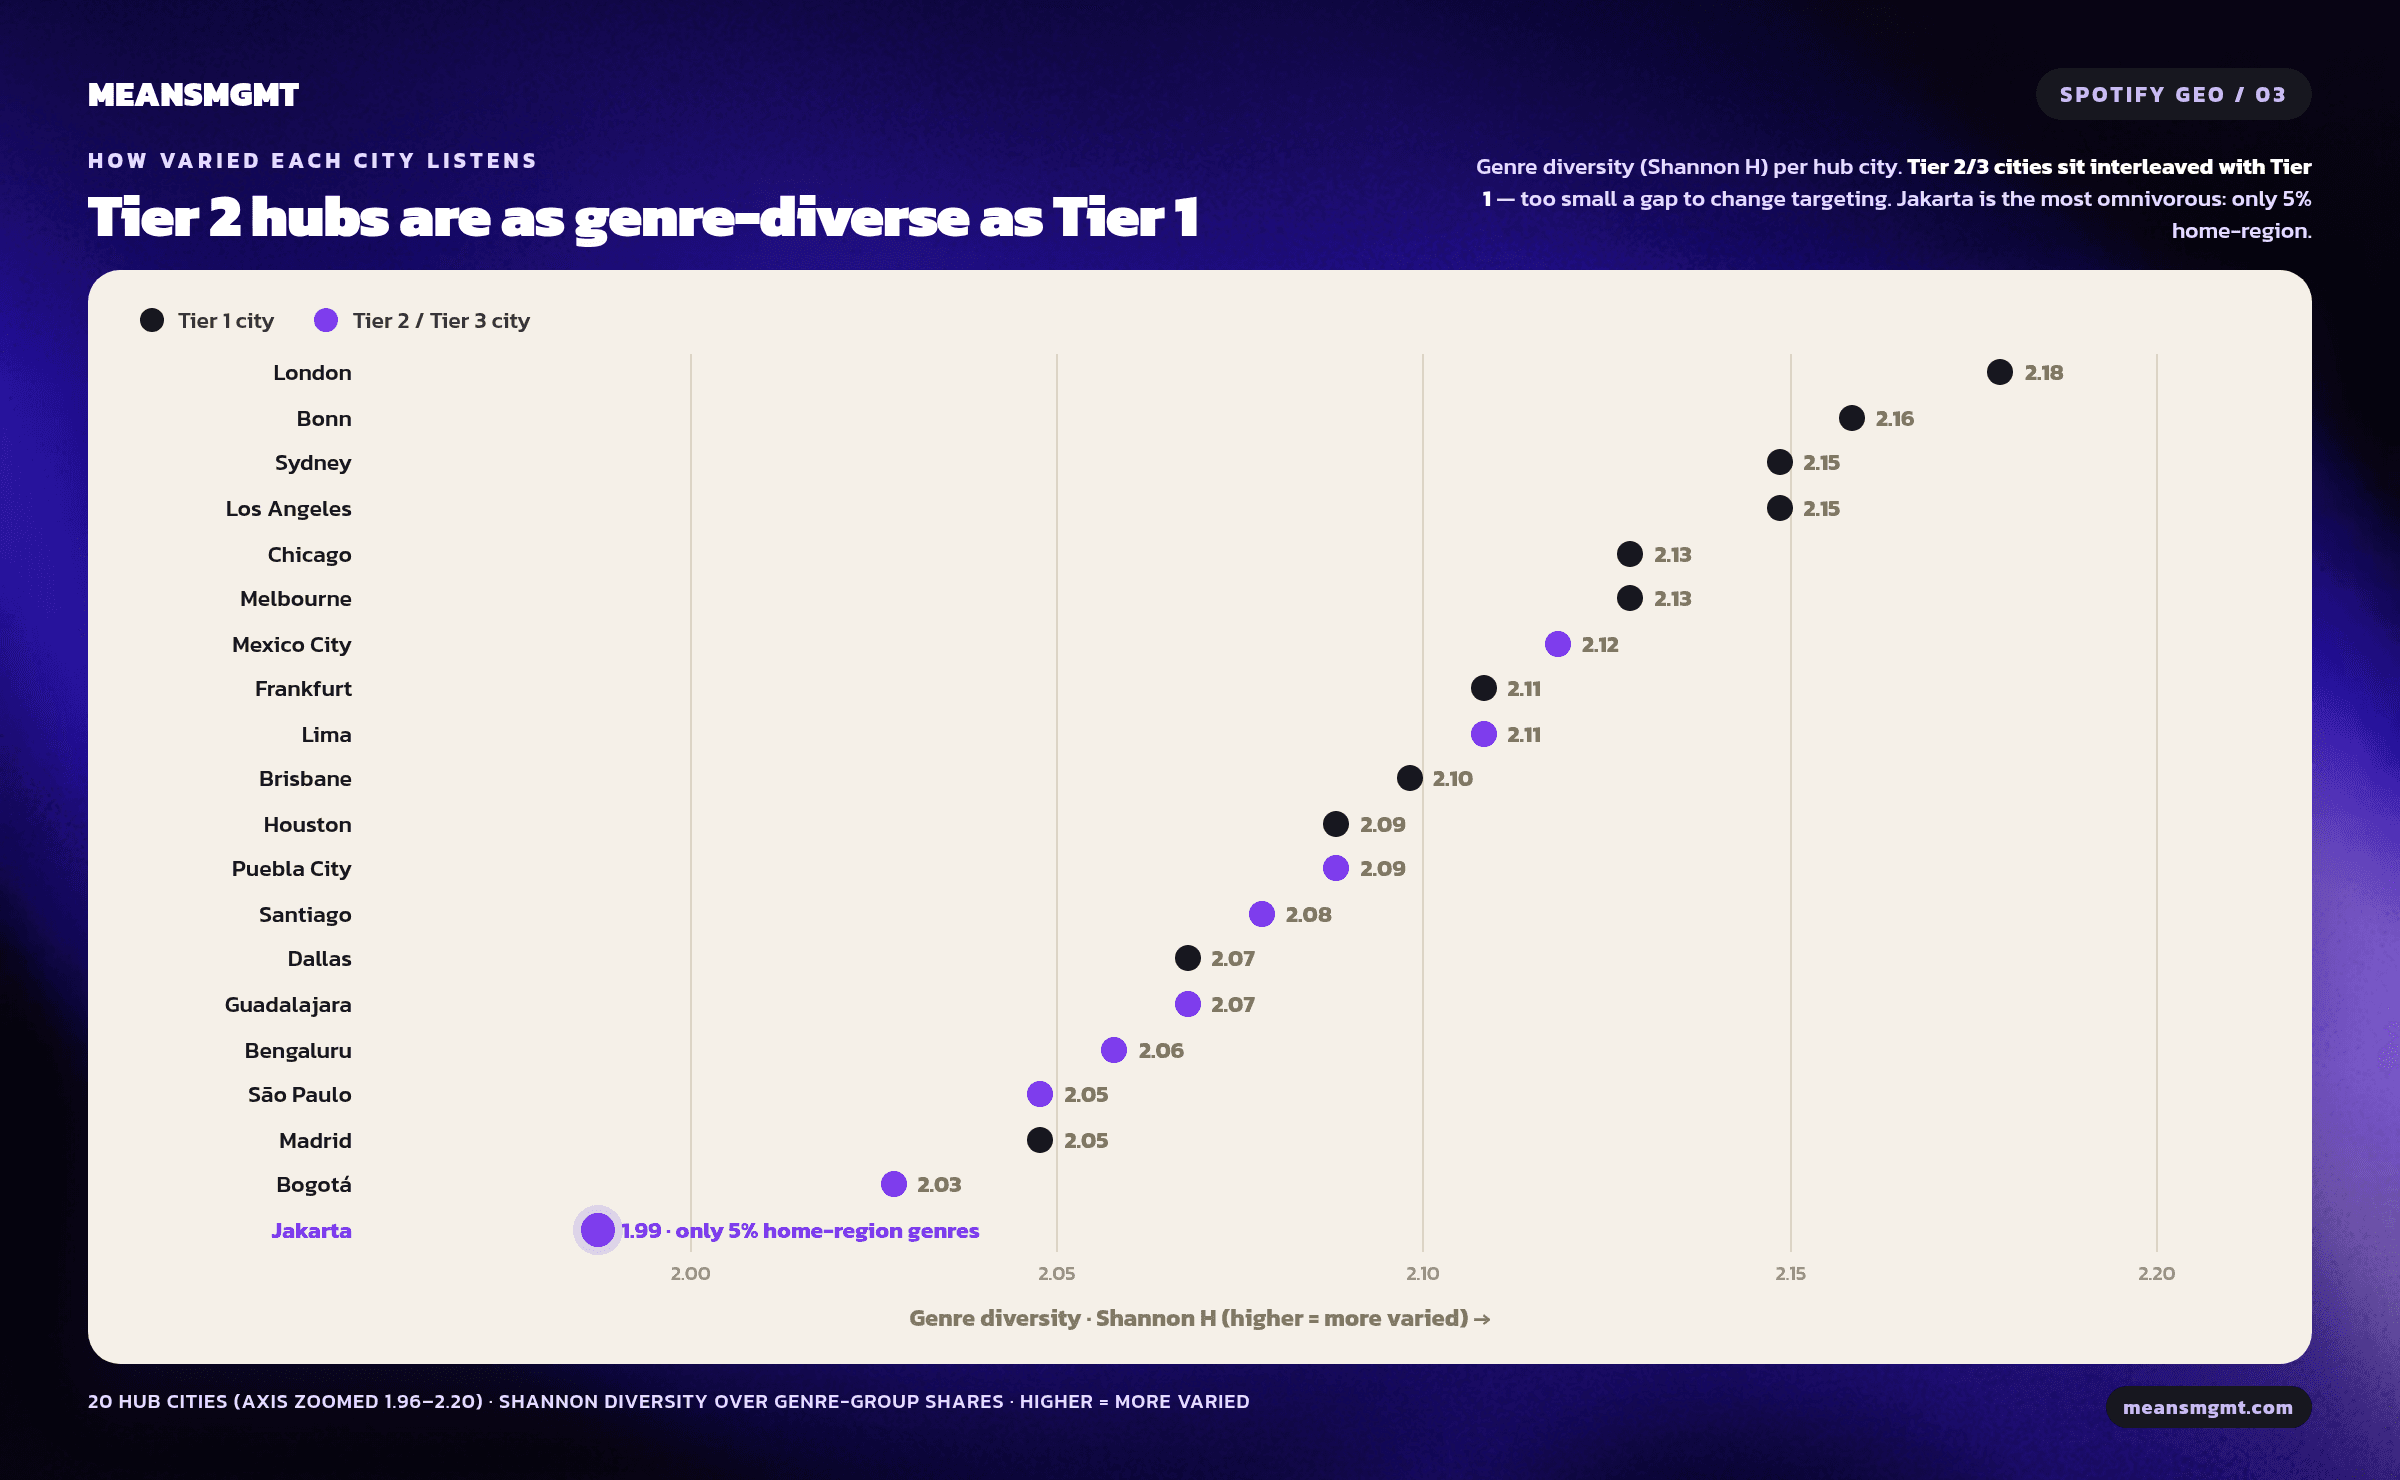
One limit on the analogy: the data shows Tier 2 presence is structural and normal at every artist size. It doesn't show that any individual artist with São Paulo in their top five is about to break a format. The claim is about where market momentum sits, not any single map.
The royalty side, stated honestly
Spotify doesn't pay a fixed rate per stream. Royalties come from country-level revenue pools split by streamshare, so a stream's value depends on where the listener is and whether they pay. Tier 2 and Tier 3 streams earn less. That part of the objection is correct, and we're not disputing it.
The cost side points the same way, at least for the reach half of the trade. In every one of our streaming campaigns where the same objective ran in both tiers for the same artist, Tier 2 cost per click came in below Tier 1. Across the three artists with a clean paired comparison, Tier 2 clicks ran between a half and a third of the Tier 1 cost. This is a within-artist comparison across a handful of accounts, from our StreamSpend benchmarks, not a portfolio-wide rate, and it measures the cost of a click to the streaming link, not the cost of a stream. The direction holds; the size of the gap moves with genre, creative, and audience.
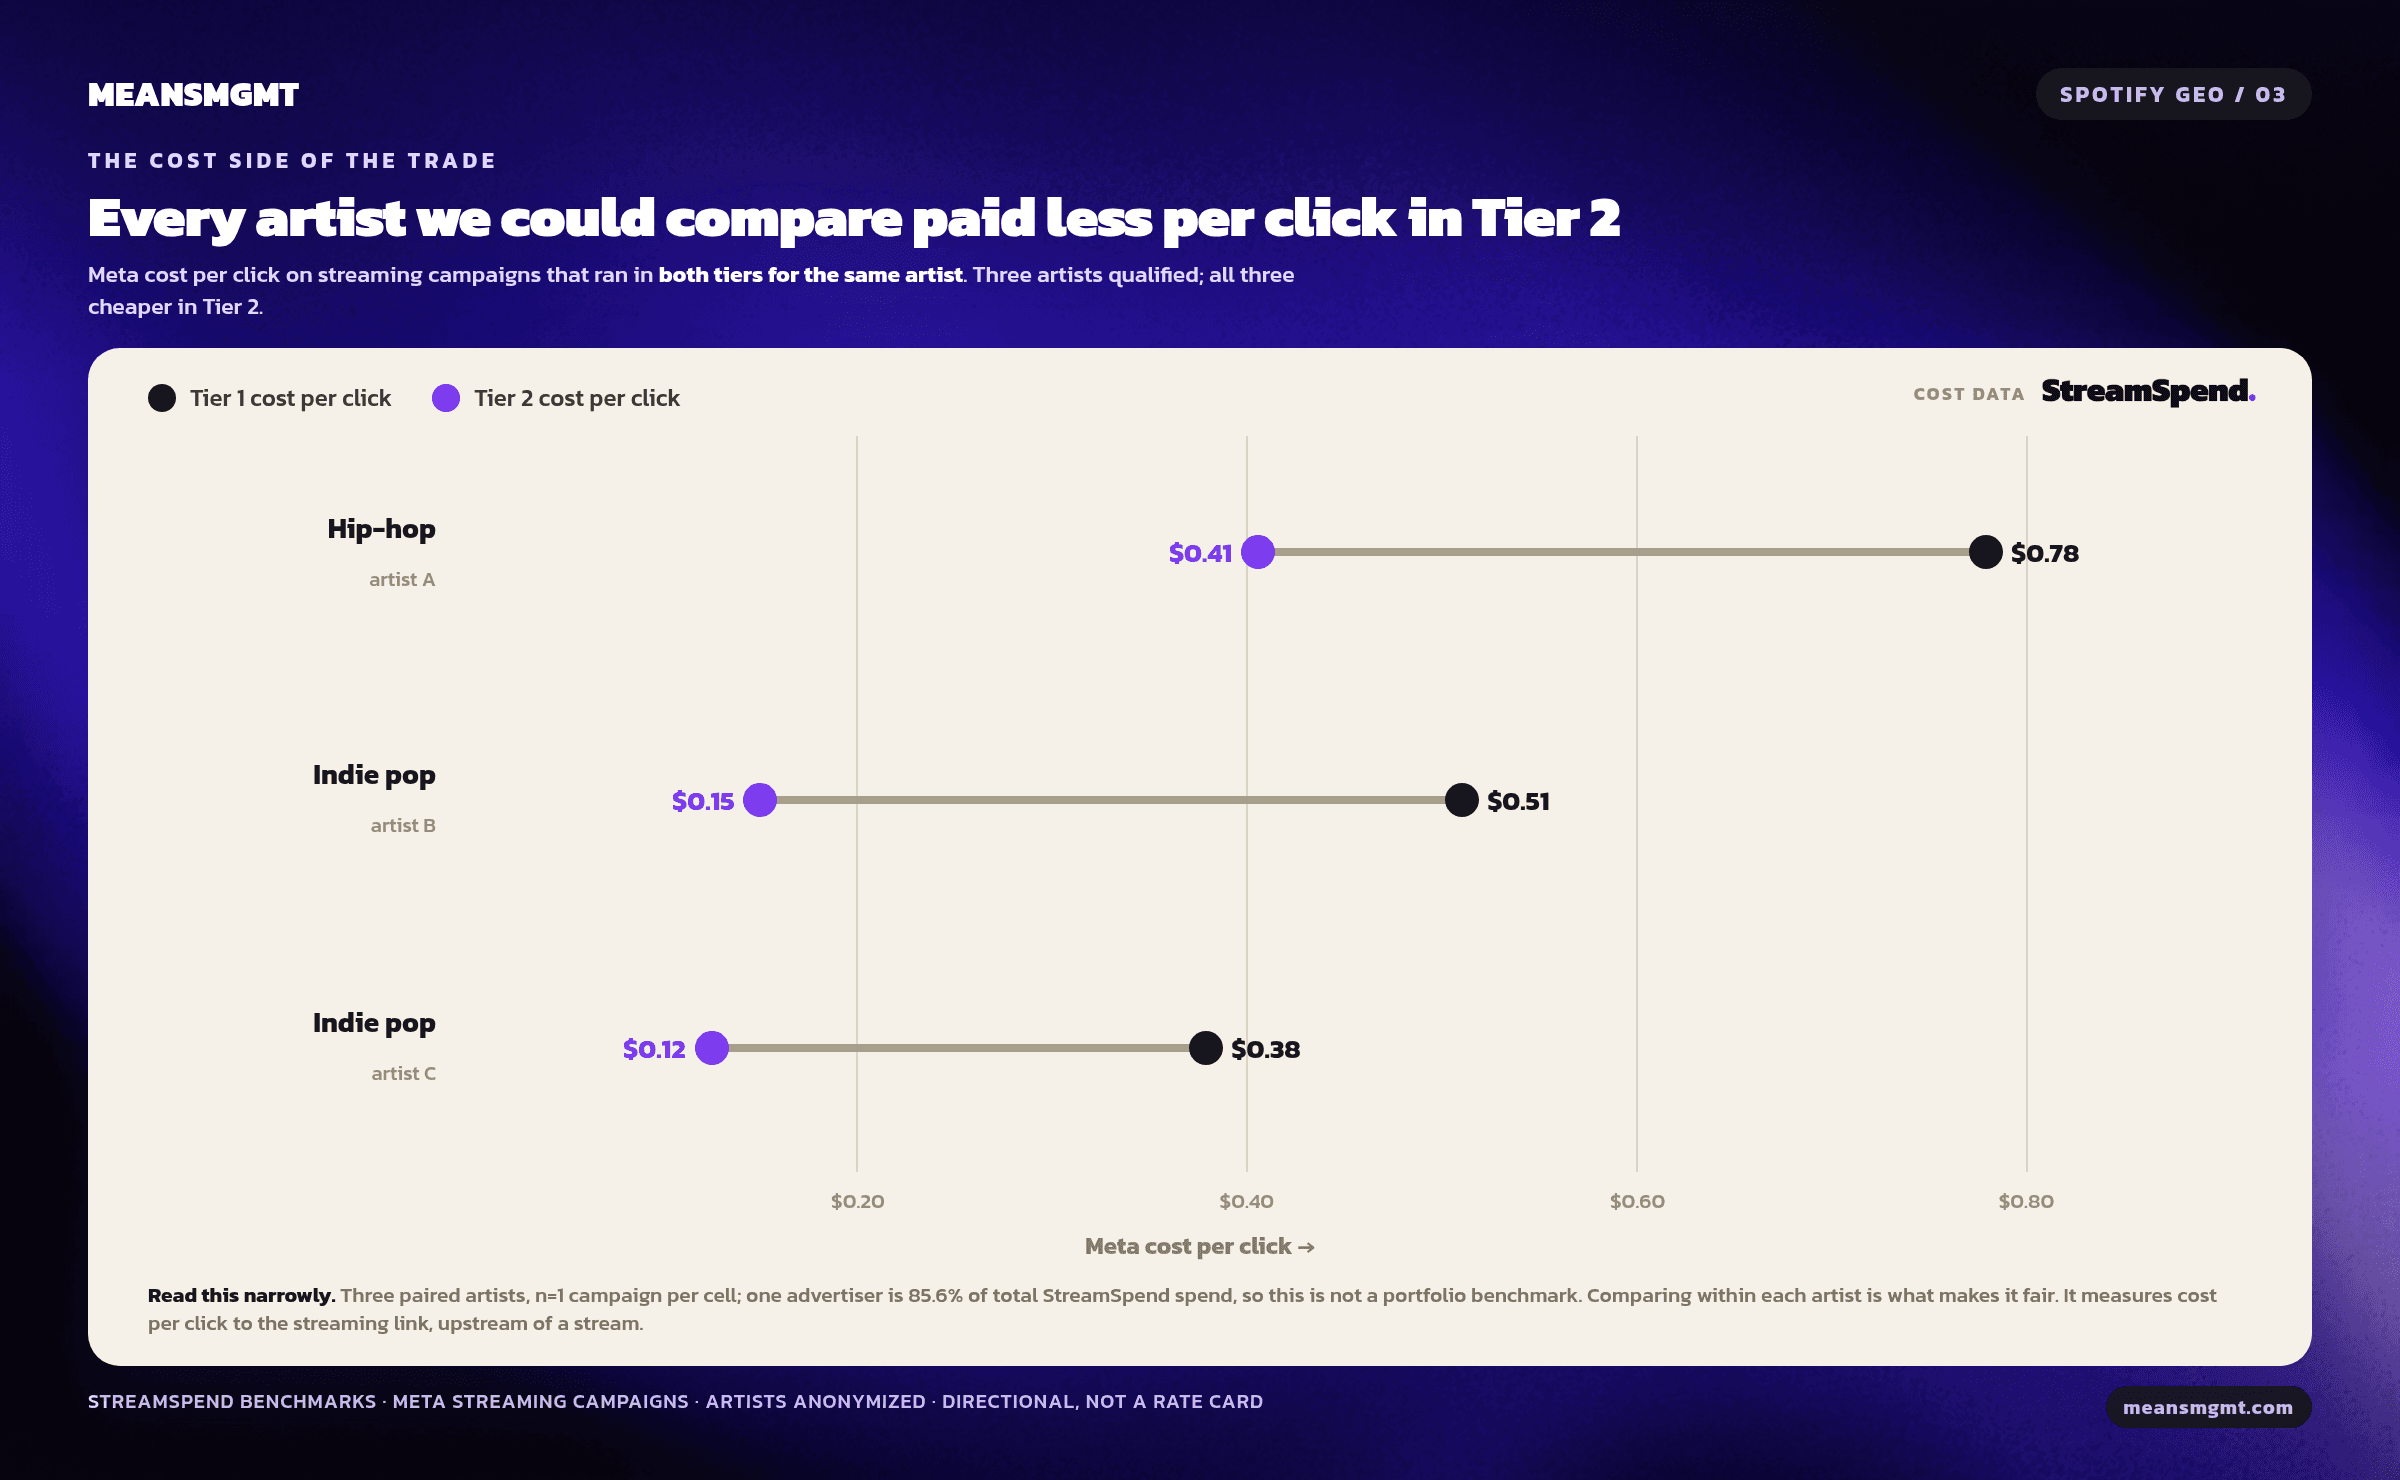
So it's a trade, not a right answer: cheaper reach and faster listener growth against lower per-stream payout and weaker short-term royalties. The two sides answer different questions.
How to structure Meta ad sets by tier
Our default streaming campaign runs roughly 60% Tier 1 and 40% Tier 2, and that ratio moves by objective and genre rather than sitting fixed.
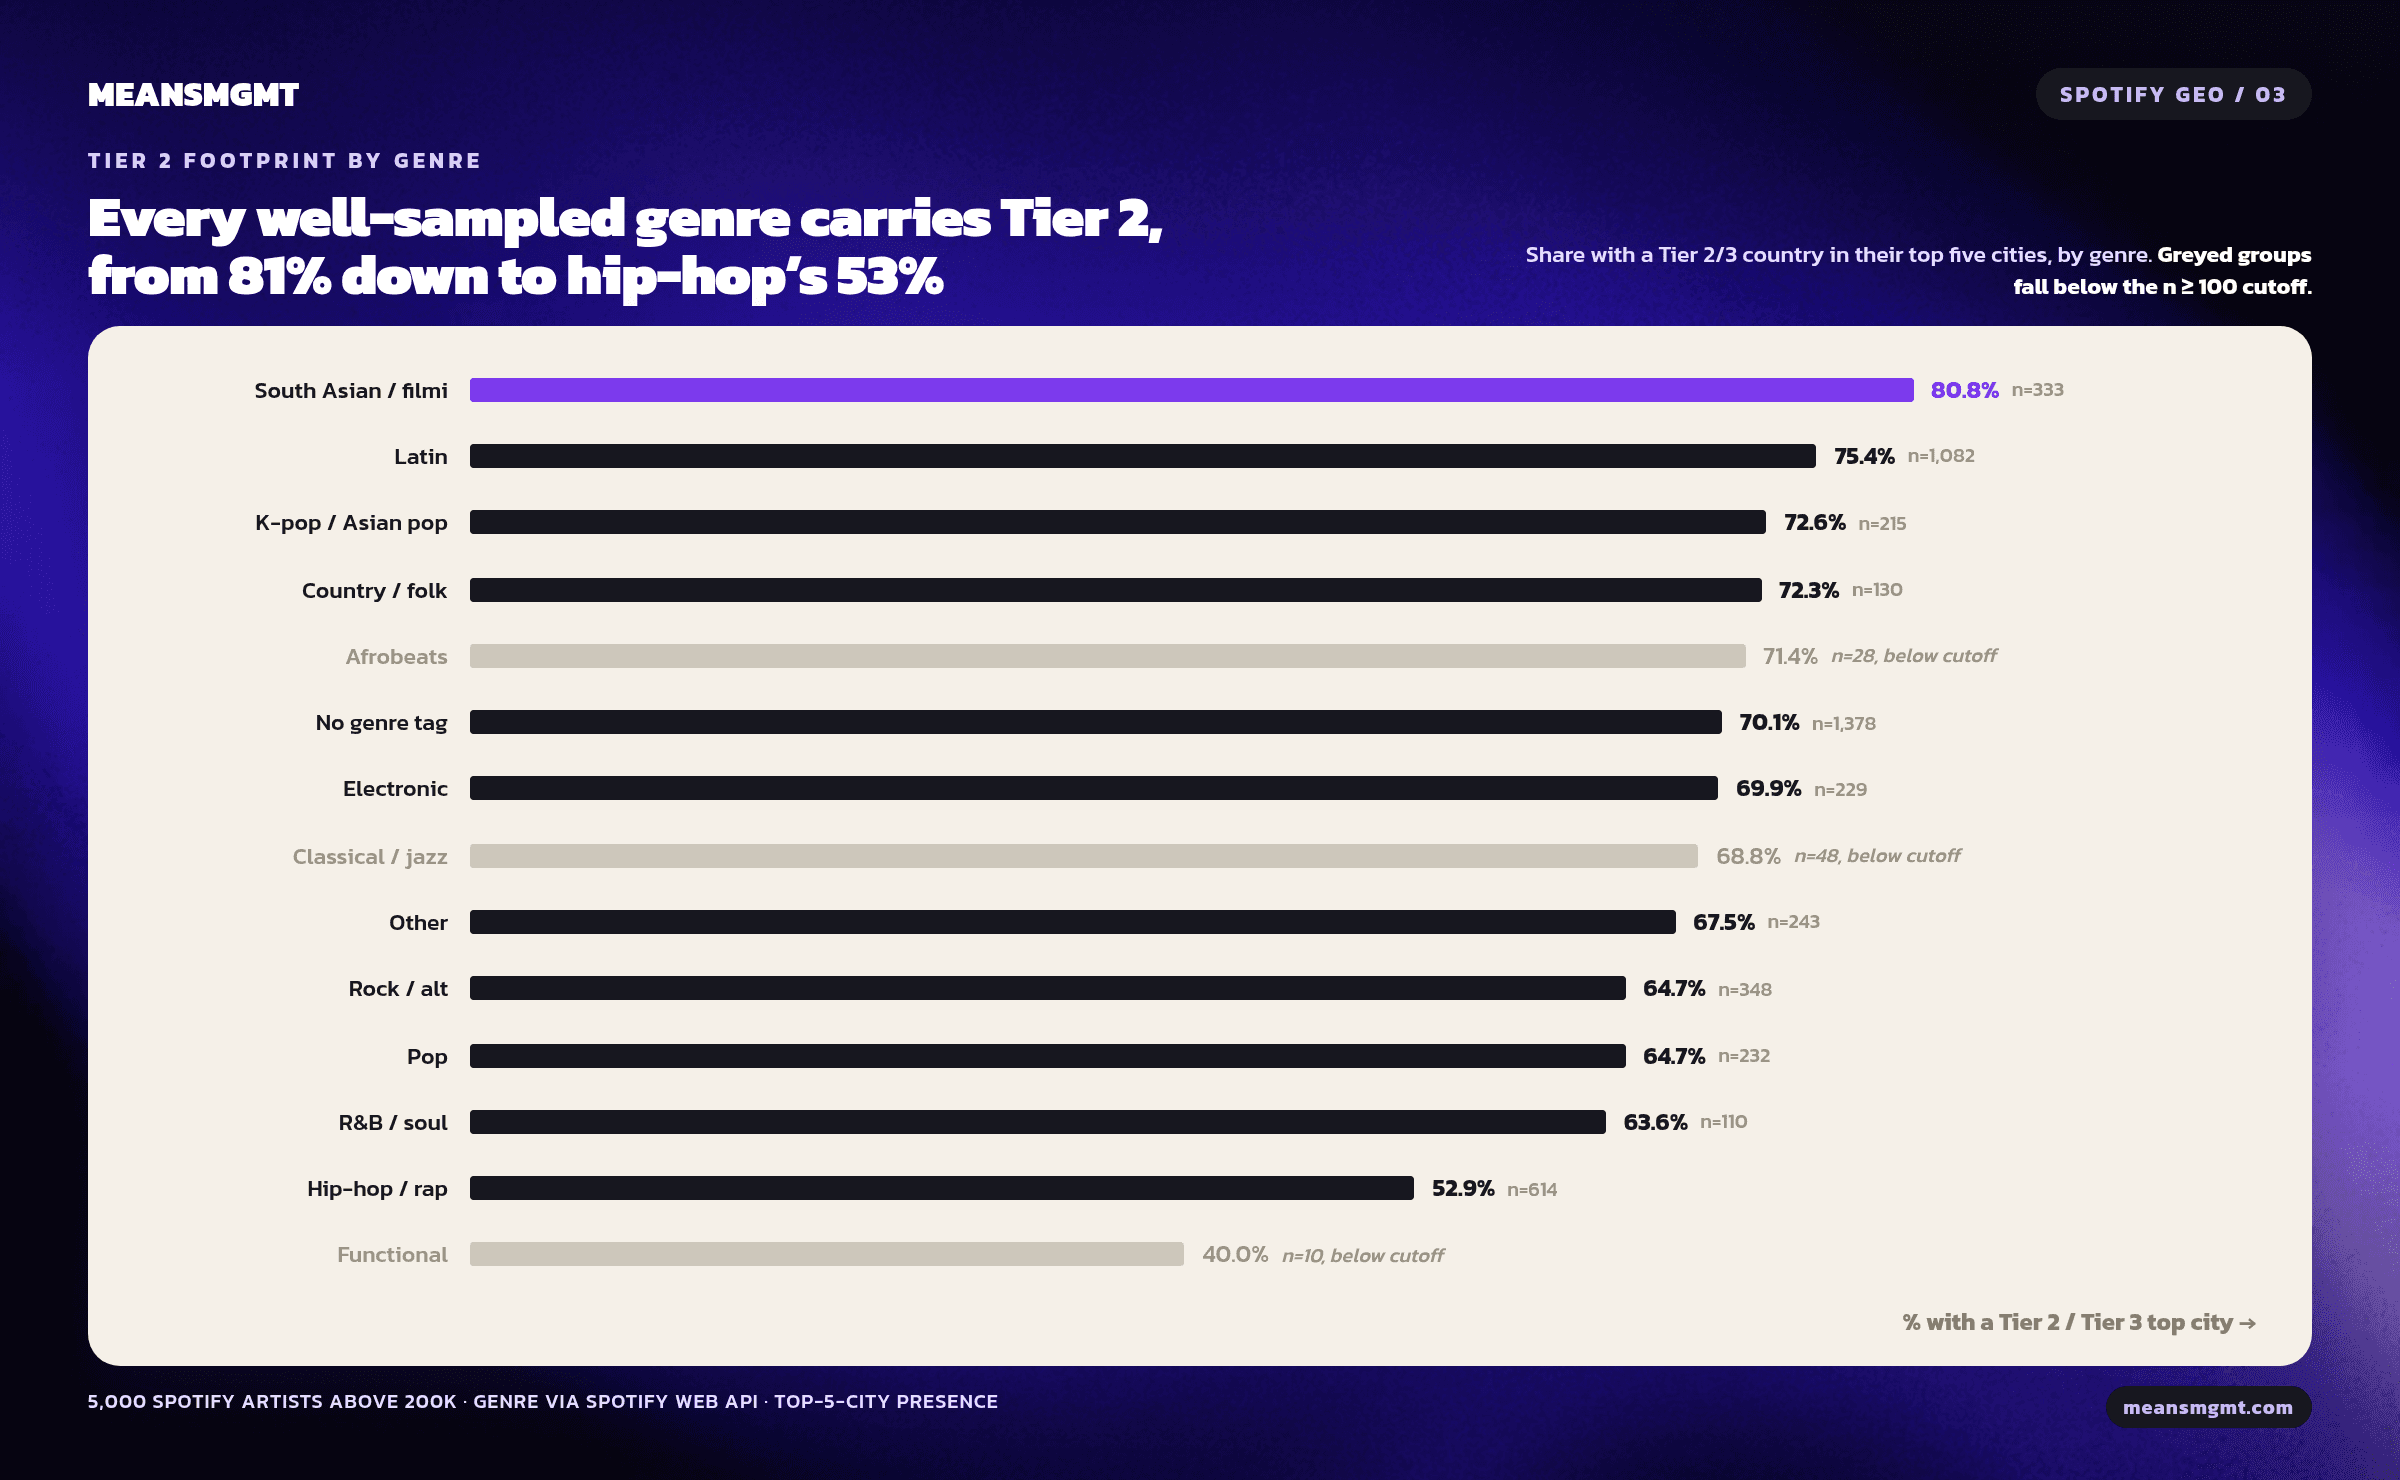
Tier 2 earns its budget when the objective is discovery and momentum: growing monthly listeners, feeding engagement signals to the algorithm, or building international audience for a genre that already lives globally. The genre data tells you which those are. South Asian and Latin genres carry the strongest Tier 2/3 footprints in the dataset at 75% to 81% top-city presence, with K-pop and country right behind at 72% to 73%.
Tier 1 takes the full budget when the objective is revenue-dense: US touring demand, UK press, merch conversion, sync attention, label conversations. Those outcomes cluster where the money is, so the spend follows.
Both lazy defaults fail. Buying cheap Tier 2 results you don't need gets you a pretty dashboard and no outcome. Cutting Tier 2 on reflex removes the exact markets IFPI, Spotify, Luminate, and MIDiA all point to as where the growth is.
Your map is a diagnostic, not a verdict. Matching geography to the objective is the decision that matters, and the cities priced as cheap right now are the same ones deciding what the next global format sounds like.
We build tier-structured streaming campaigns for artists and labels every day, and we read the geography behind every one. If you want help deciding where your ad budget should actually go, reach out at meansmgmt.com.
Sources
MeansMGMT internal dataset: top-five Spotify city pulls for 5,000 artists above 200K monthly listeners plus roughly 2,000 between 1K and 200K, collected June 26 to July 11, 2026, via public artist profiles. Tier definitions and method in part 1.
IFPI Global Music Report 2026 (Latin America +17.1%, fastest region, 16th consecutive year), via Music Business Worldwide: musicbusinessworldwide.com
Spotify, Loud & Clear 2026 (16 languages in the Global Top 50; majority of royalties earned outside home countries within two years of debut; genre royalty growth): newsroom.spotify.com and hypebot.com
Luminate 2025 Year-End Report (India premium streams +42% YoY, +23.3B; four countries = 48.9% of global premium streams), via Music Business Worldwide: musicbusinessworldwide.com
MIDiA Research, "Music subscriber market shares Q4 2025" (Global South 70%+ of subscriber growth five years running; Brazil driving Latin America's record net additions): midiaresearch.com
Spotify for Artists, Royalties Guide (streamshare model, no fixed per-stream rate): artists.spotify.com
MeansMGMT StreamSpend benchmarks (internal, 2026): Meta cost per click by geo tier, within-artist paired comparisons (three artists with a campaign in both tiers on the same objective). Directional; not a portfolio-wide rate.
MeansMGMT city genre-diversity analysis (internal, July 2026): Shannon diversity over genre-group shares per hub city; Jakarta cross-regional import share.
FAQ
Should musicians target Tier 2 and Tier 3 countries in Spotify ads?
What are Tier 1, Tier 2, and Tier 3 markets?
Is a Tier 2 stream worth less than a Tier 1 stream?
Where is music streaming growing fastest in 2026?

This is the work we do all day.
If you have a release coming, the 3-minute intake tells us everything we need to scope your campaign. Want the numbers first? The benchmarks report is free.