

A $20 placement stays in your data for months after the invoice clears. Rented geography fades; retained geography sticks.
Here's a sequence that plays out constantly in independent music. You spend $50 to $100 on playlist placements in the spring, watch a month of elevated streams, and move on. A few months later you run your first ad campaign, open Spotify for Artists two weeks in, and there's Belo Horizonte and Guadalajara in your top five cities. The ads get blamed.
Usually the timeline runs the other way. Those cities were often there before the first ad impression served. The campaign was just the most recent thing to look at, not the thing that put them there. And before we get to the geography, the money, because playlist placement cost is the first thing most artists want to compare.
What playlist placement actually costs in 2026
Three platforms account for most independent placement spend, at three different price points.
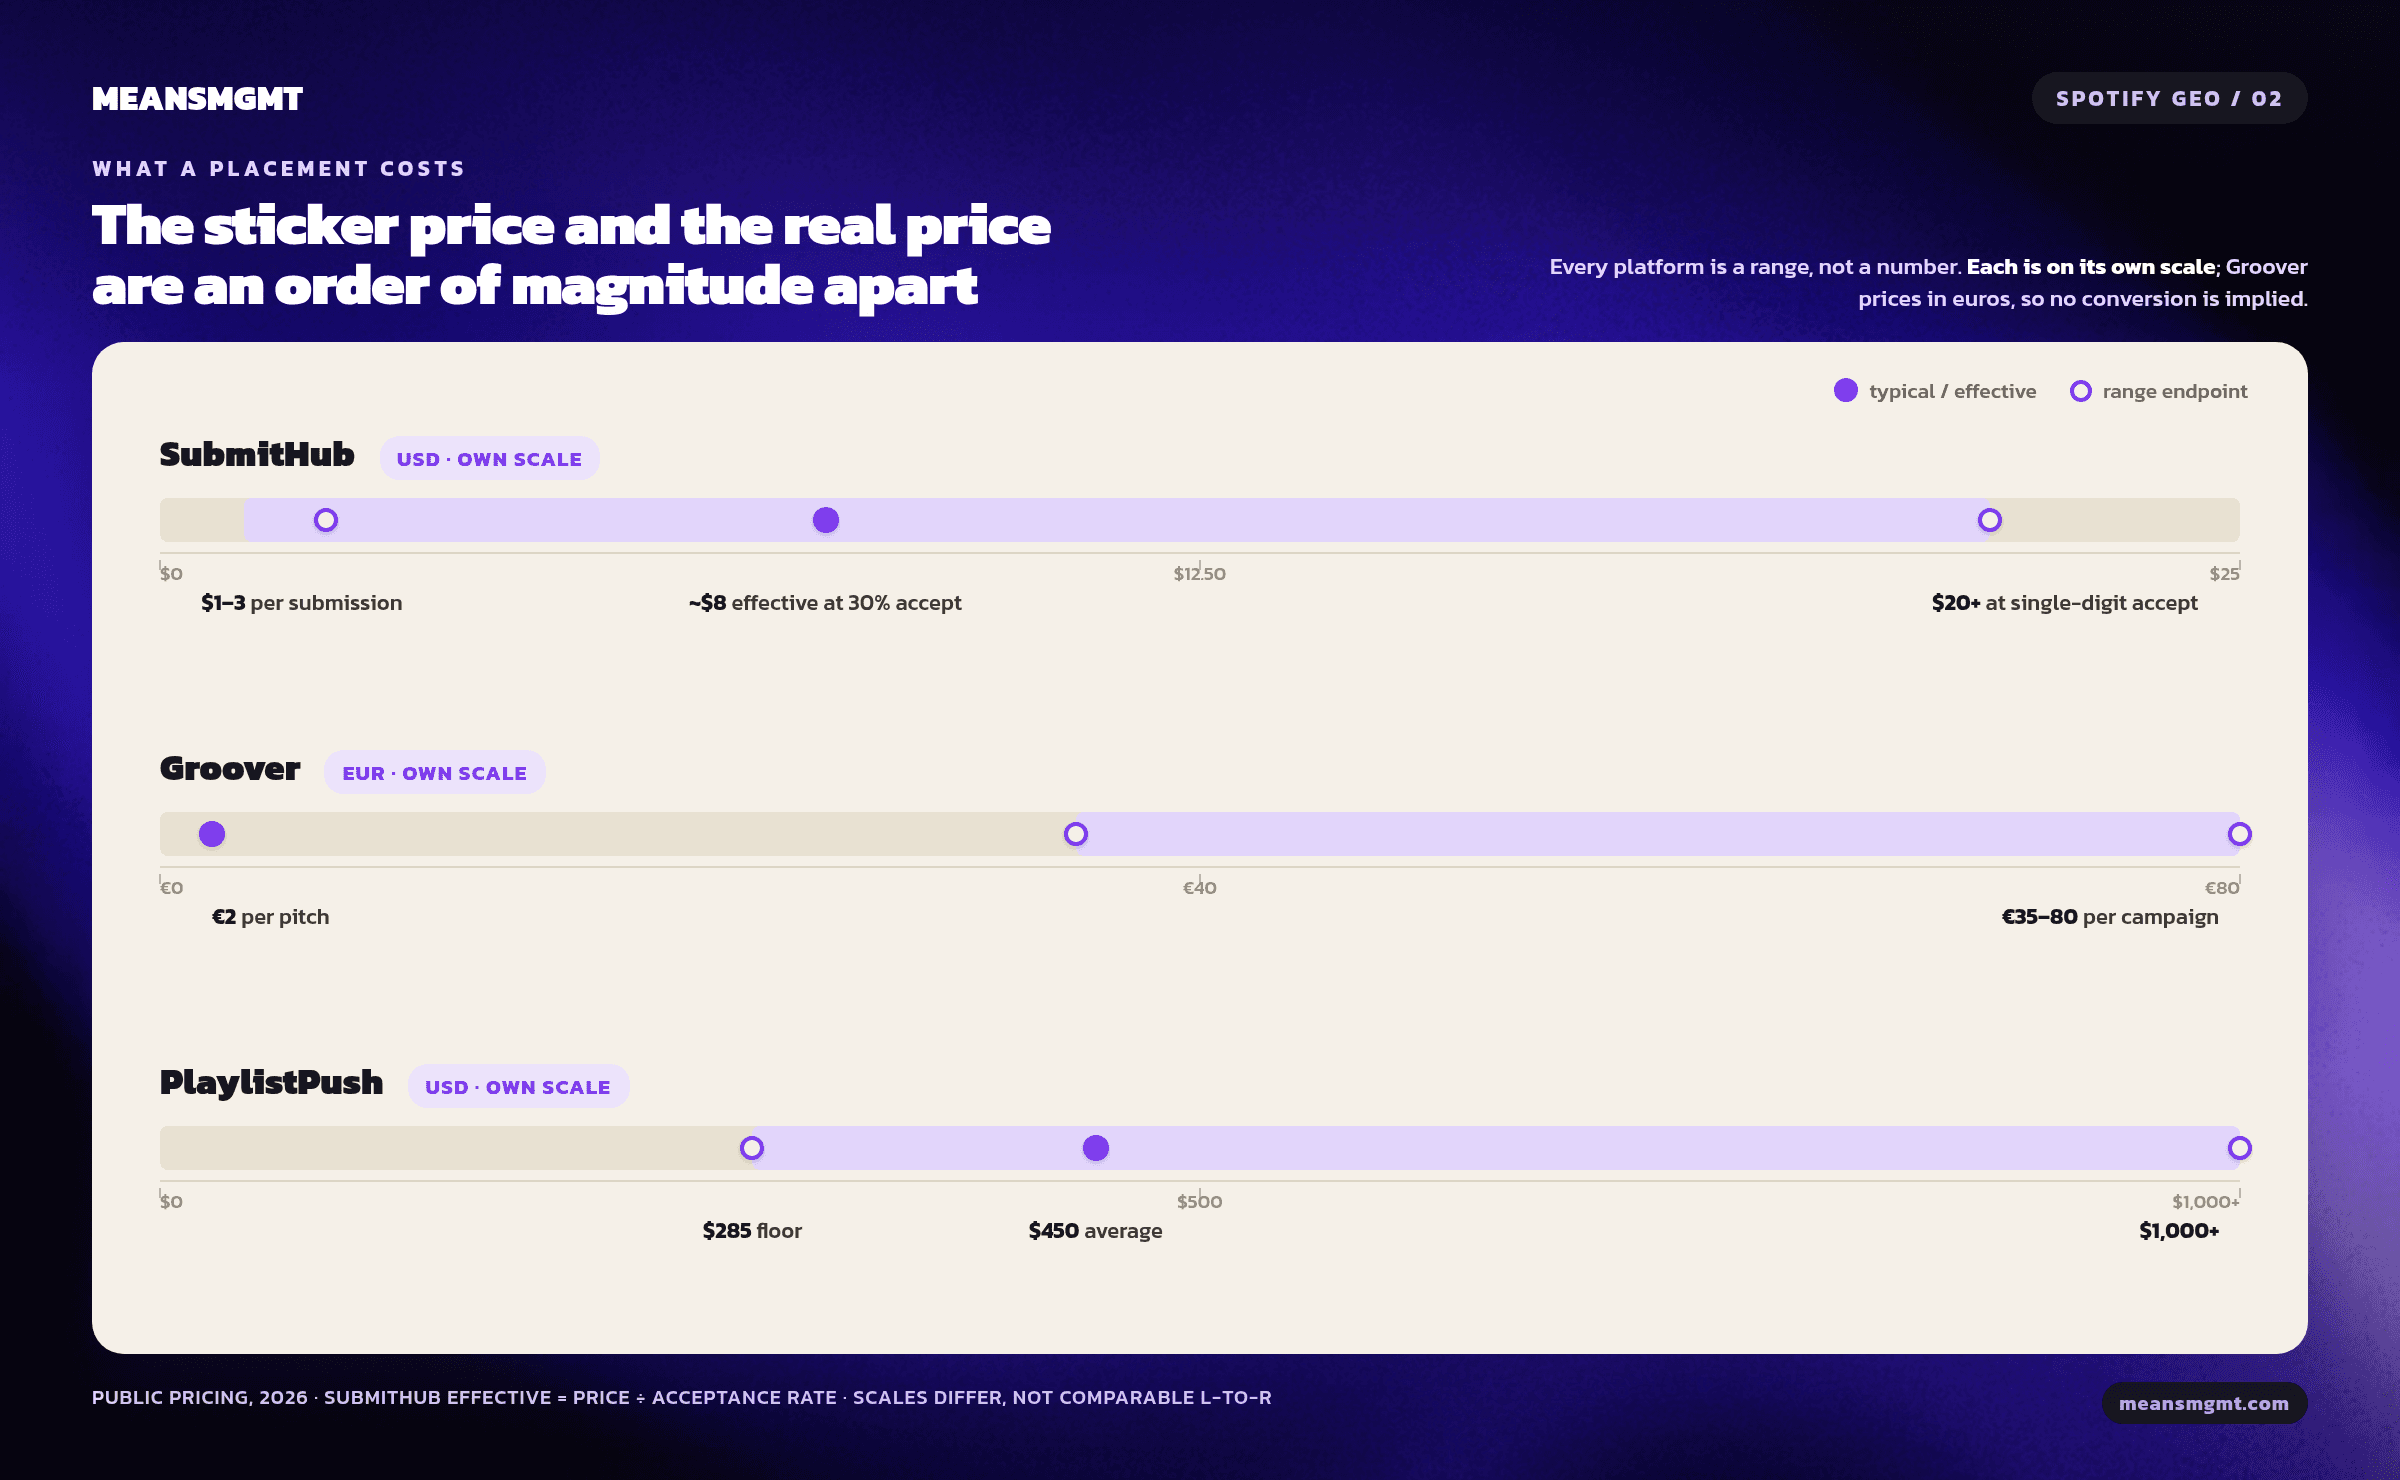
SubmitHub sells premium credits at roughly $1 to $3 per submission, dropping to about $0.80 each at volume. Curators cost one to five credits depending on tier. What you actually pay per accepted placement depends on the acceptance rate, and that swings a lot. SubmitHub's own published average sits near 30%; independent estimates run 5 to 19%. At 30%, effective cost lands under $10 a placement; at single-digit acceptance it climbs past $20.
Groover charges 2 "Grooviz" per pitch at €1 each, so about €2 a pitch, with bulk packs starting at €46 and discounts up to 24% at volume. A 50-curator campaign lists around €100, closer to €80 with the pack discount.
PlaylistPush sits in a different bracket. Spotify campaigns start at $285 and run past $1,000, averaging around $450, priced by how many curators you target rather than by fixed tiers.
In all three, the product is the same: access to a curator's existing follower base.
Is playlist pitching worth it? Watch the geography
That follower base is where the geography comes in. Playlist audiences get built, and the methods vary. Some grow organically over years. Others grow through follower ads, cross-promo networks, giveaways, and sometimes the outright sale of established playlists with their followers attached. Building an audience costs money, and it costs a lot less in Tier 2 and Tier 3 markets, where follower and click costs run a fraction of US rates. A curator pushing toward 40,000 followers on a tight budget has every reason to buy them where they're cheapest.
Get placed on that playlist, and you inherit its geography for as long as you're on it.
A mechanism, not a measured result
One thing to be straight about: this is a mechanism, not a proven result.
No public dataset shows that paid placements shift an artist's listener geography toward Tier 2 and Tier 3 markets. No before-and-after study exists, and we haven't produced one. What's established is narrower: curator audiences carry their own geography, audience acquisition is cheaper outside Tier 1, and practitioners almost universally believe the effect is real. That's a plausible mechanism backed by pricing structure. It isn't a finding, so don't read it as one.
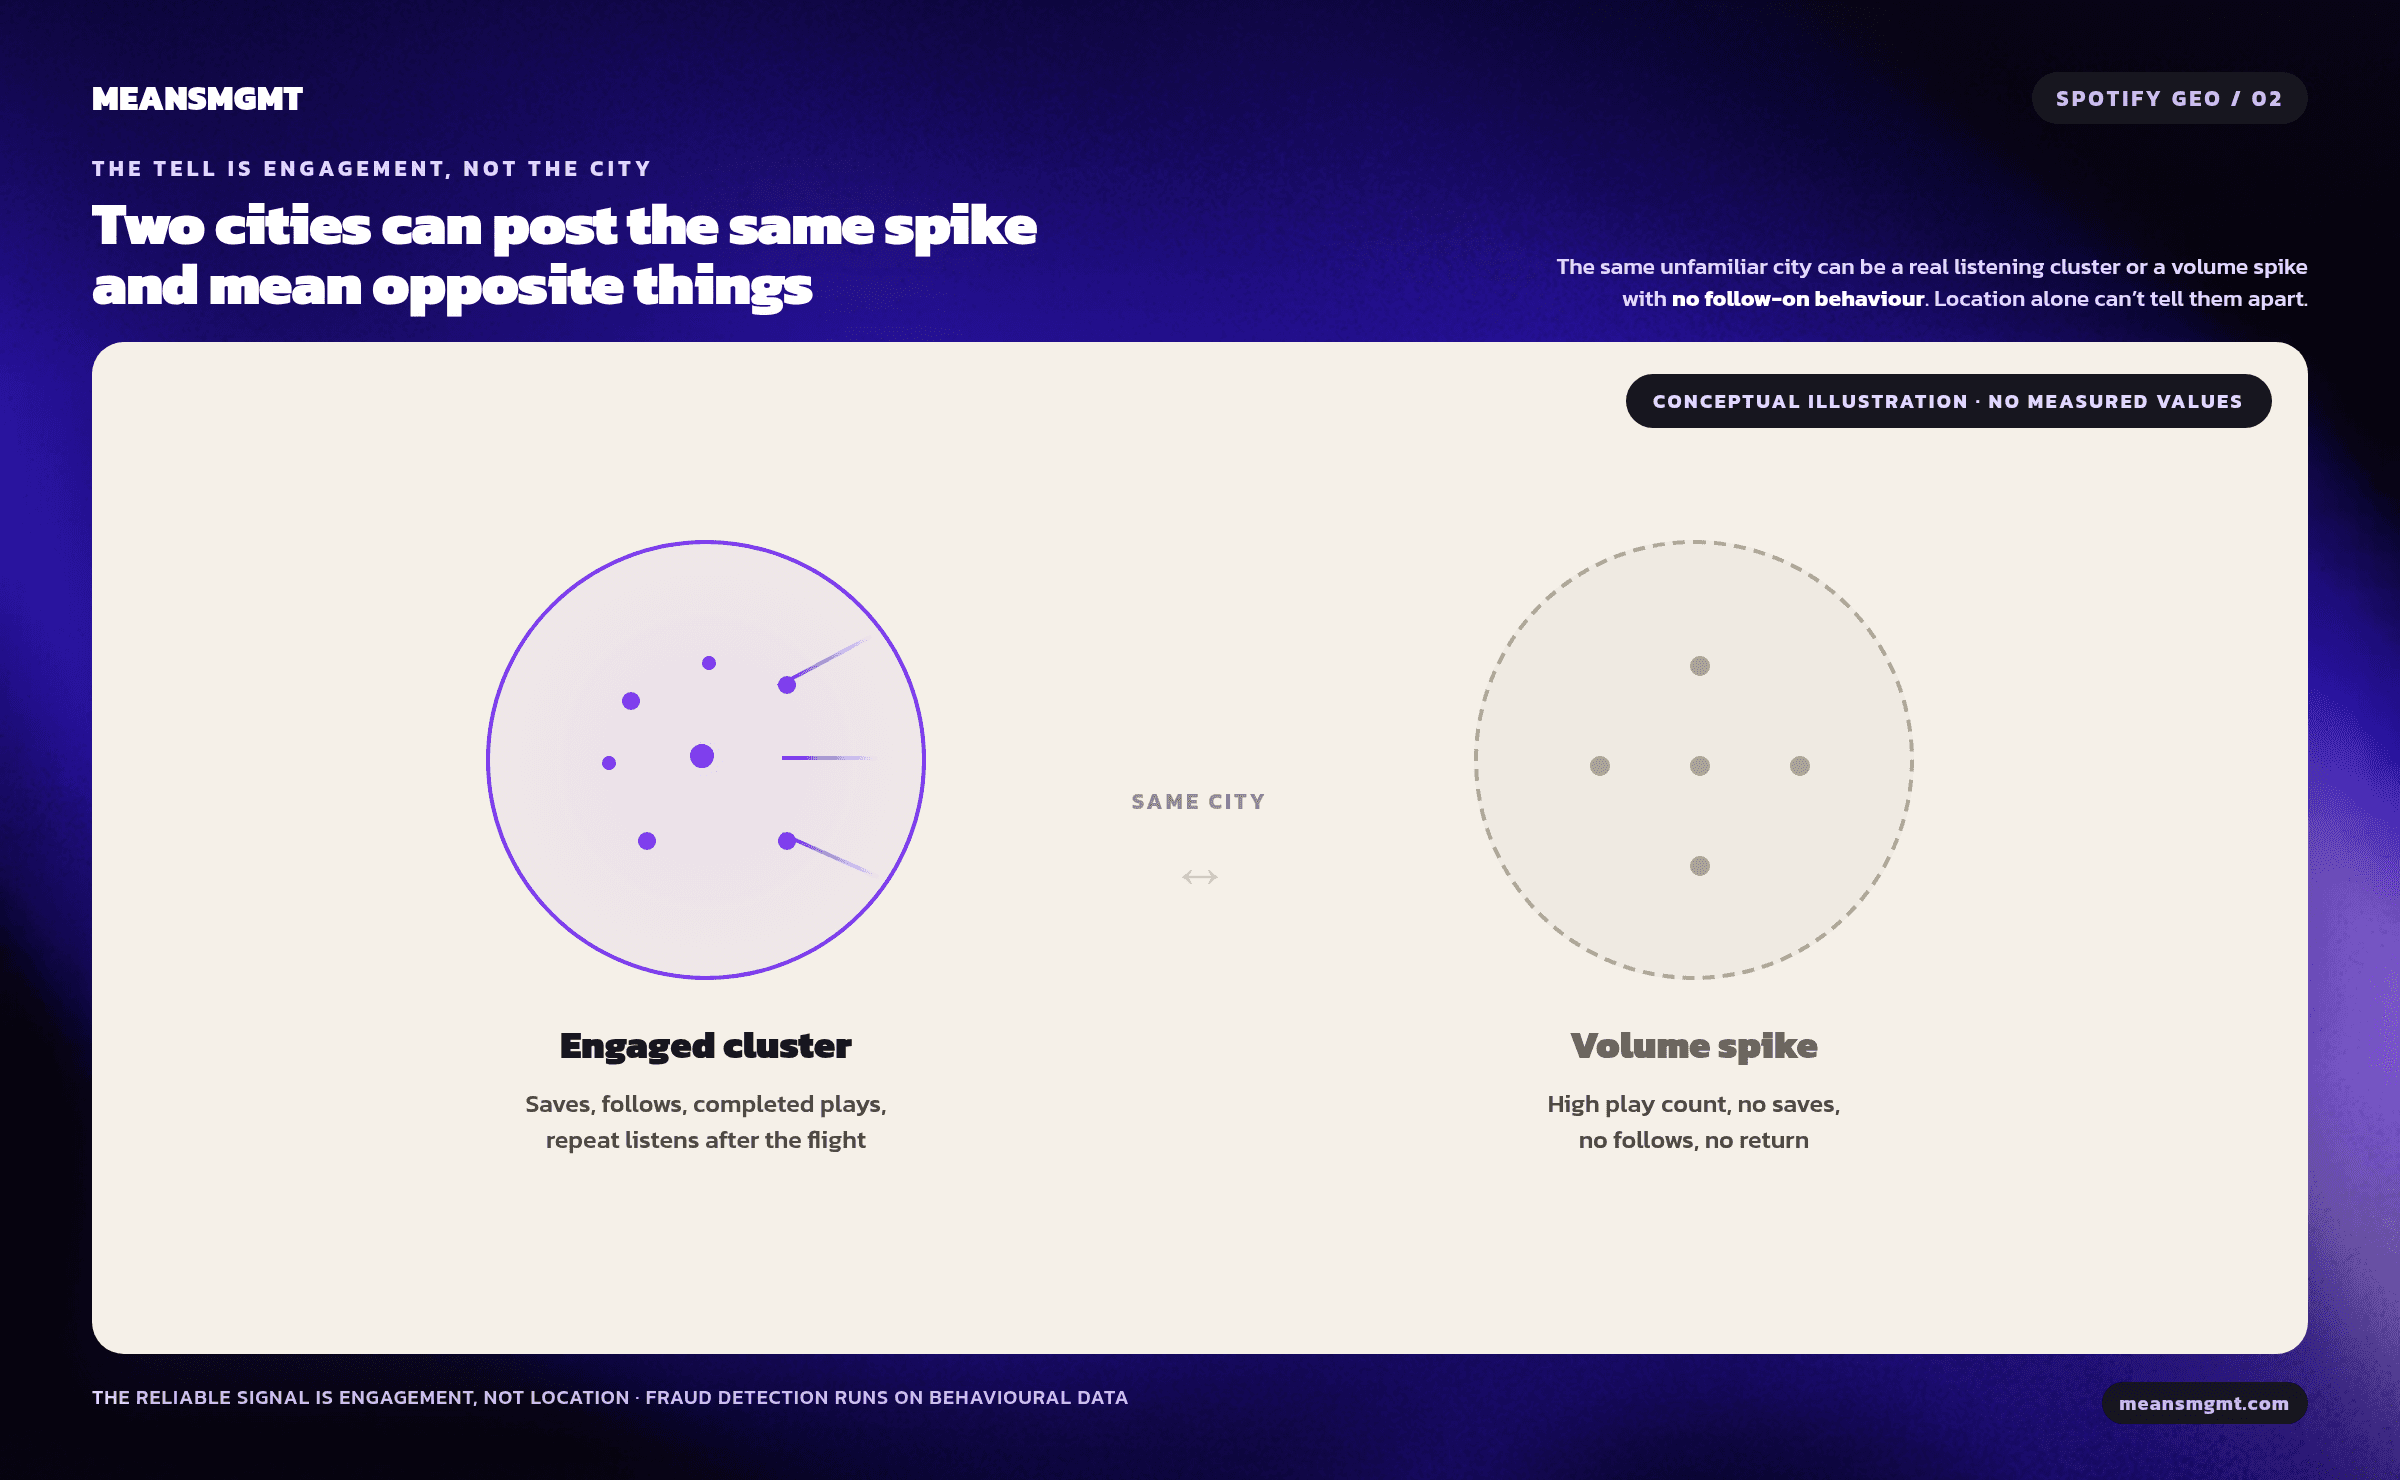
The adjacent problem is documented, though. PlaylistPush publishes a distinction between trigger cities and bot cities. Trigger cities, a term from Chartmetric's research (2019, updated in its 2024 report), are metros where listeners pick up new artists earlier and more actively than in saturated Western markets. Chartmetric's 2024 report identifies Latin America as hosting the largest concentration, tied to population density, streaming adoption, and social sharing. Bot cities are the inverse: geography manufactured by farmed engagement.
The same city can be either. Location alone won't tell them apart.
Why one placement moves a small artist's map
Part one covered the arithmetic. Across roughly 7,000 artist profiles, the median fifth city for artists between 1,000 and 5,000 monthly listeners is 35 listeners. A single placement whose audience clusters in two or three metros can fill a big share of a small artist's visible map, and where the organic base is thin, those cities can sit right at the top of it.
The lag is what causes the misattribution. Placements run in one quarter. You examine the map in the next, usually when you start advertising and finally have a reason to look.
Three ways to tell rented geography from retained
Timing is the first. Cities carry a first-appearance date you can line up against your marketing calendar. Cities that show up during or just after a placement window belong to the placement. Cities that appear mid-flight in markets your ads actually targeted belong to the ads. Spotify for Artists won't build this timeline for you, so a screenshot before each new campaign is the only reliable way to keep it.
Engagement is the second. Stream counts alone won't separate a trigger city from a farmed one. Saves, follows, and playlist adds will. Real discovery markets keep generating engagement past the first play. Rented playlist audiences mostly don't.
Persistence is the third, and the cleanest test you've got. Playlist geography is temporary by design. When a curator rotates your track out, usually within a couple of months, the listeners who never converted stop showing up and their cities fade. Cities that stick around after a placement ends are retained audience. Cities that vanish were the playlist's the whole time.
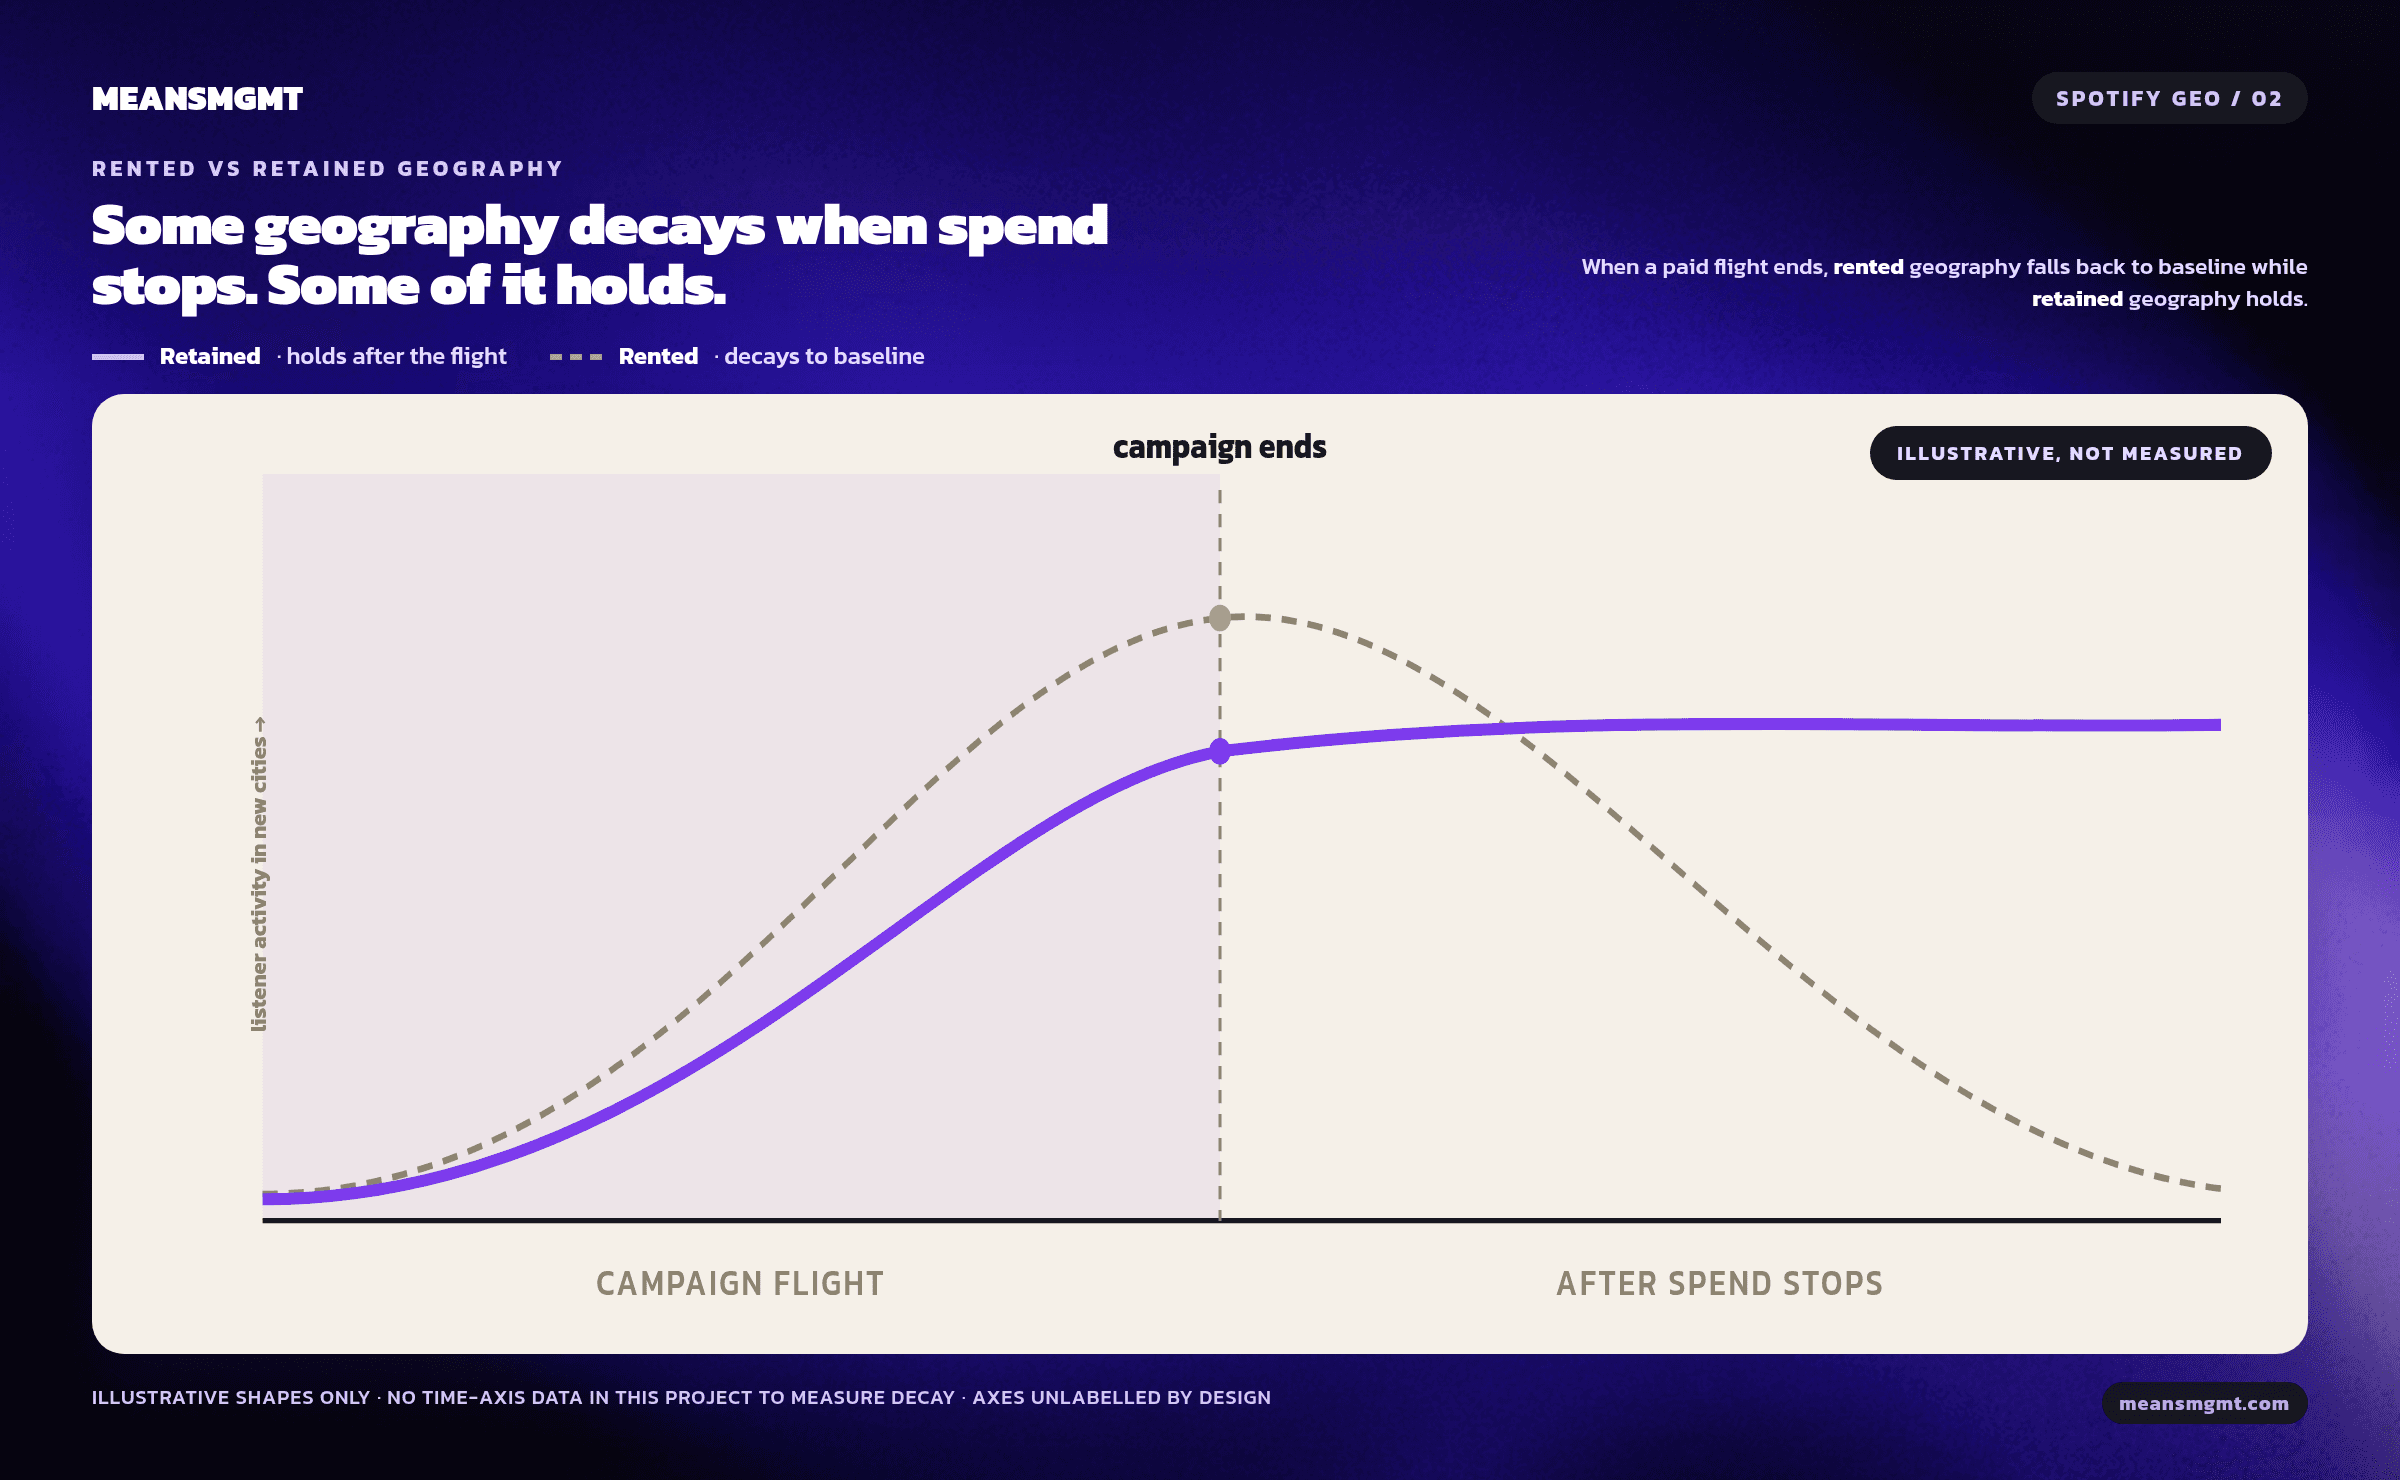
Placements can absolutely be worth it. The point is that a $20 line item stays in your data for months after the invoice clears, and an unaccounted variable produces wrong conclusions about every campaign that comes after it.
The markets that show up in rented playlist geography, mostly Latin America, India, and Southeast Asia, are also where recorded music's measured growth is concentrated. Part three digs into that overlap and whether you should target Tier 2 markets on purpose.
We run streaming campaigns for artists and labels every day, and we read maps like this before, during, and after every flight. If you want a second set of eyes on where your listeners are actually coming from, reach out at meansmgmt.com.
Sources
SubmitHub premium credit pricing and volume tiers: submithub.com and chartlex.com
Groover pricing (Grooviz rate, pack discounts): groover.co
PlaylistPush campaign pricing: playlistpush.com and help.playlistpush.com
PlaylistPush, "Trigger Cities vs. Bot Cities": playlistpush.com/blog
Chartmetric Trigger Cities Report 2024 (Latin America concentration, methodology): reports.chartmetric.com and hmc.chartmetric.com
Spotify Support, third-party services that guarantee streams: support.spotify.com
Dynamoi, playlist vetting checklist (spotting fake playlists): dynamoi.com
MeansMGMT internal dataset: 7,000 Spotify artists' top-five cities, pulls June 26 to July 11, 2026. Method and tier definitions in part 1.
FAQ
How much does a Spotify playlist placement cost?
Is PlaylistPush worth it?
What's the difference between SubmitHub, Groover, and PlaylistPush?
How do you spot a fake Spotify playlist?

This is the work we do all day.
If you have a release coming, the 3-minute intake tells us everything we need to scope your campaign. Want the numbers first? The benchmarks report is free.