·
Paid ads
·
What Spotify for Artists Can and Can't Tell You About Your Ads
Here is what Spotify For Artists data can show about ads, and what it cannot.

MeansMGMT
Algorithmic streams rose and fell in step with total streams. Watch the stream count, not the share.
Most questions about ads and the Spotify algorithm get answered from one campaign and a screenshot. I wanted a bigger table.
Most of what I expected to find did not survive a second look. What did survive is mostly about how to read your own numbers, so that is what this post covers.
Artists are labeled A through I. Time is counted from each campaign, and spend is shown as an index, not dollars.
The table you have to copy by hand
The source-of-streams breakdown in Spotify for Artists splits your plays by where they came from. The rows include your profile, listener libraries, editorial playlists, other people's playlists, and "personalized playlists, autoplay and mixes."
That last row is what most people mean by the algorithm. It covers Radio, autoplay, Daily Mixes, Discover Weekly and Release Radar.
There is no export for it... You read it 28 days at a time, one artist at a time (thanks Spotify). That is why most published claims about ads and the algorithm rest on one campaign.
Share is often the wrong number to watch
The common check is the algorithm's share of your streams: did it go up during the campaign?
In this data, share and stream counts often told different stories.
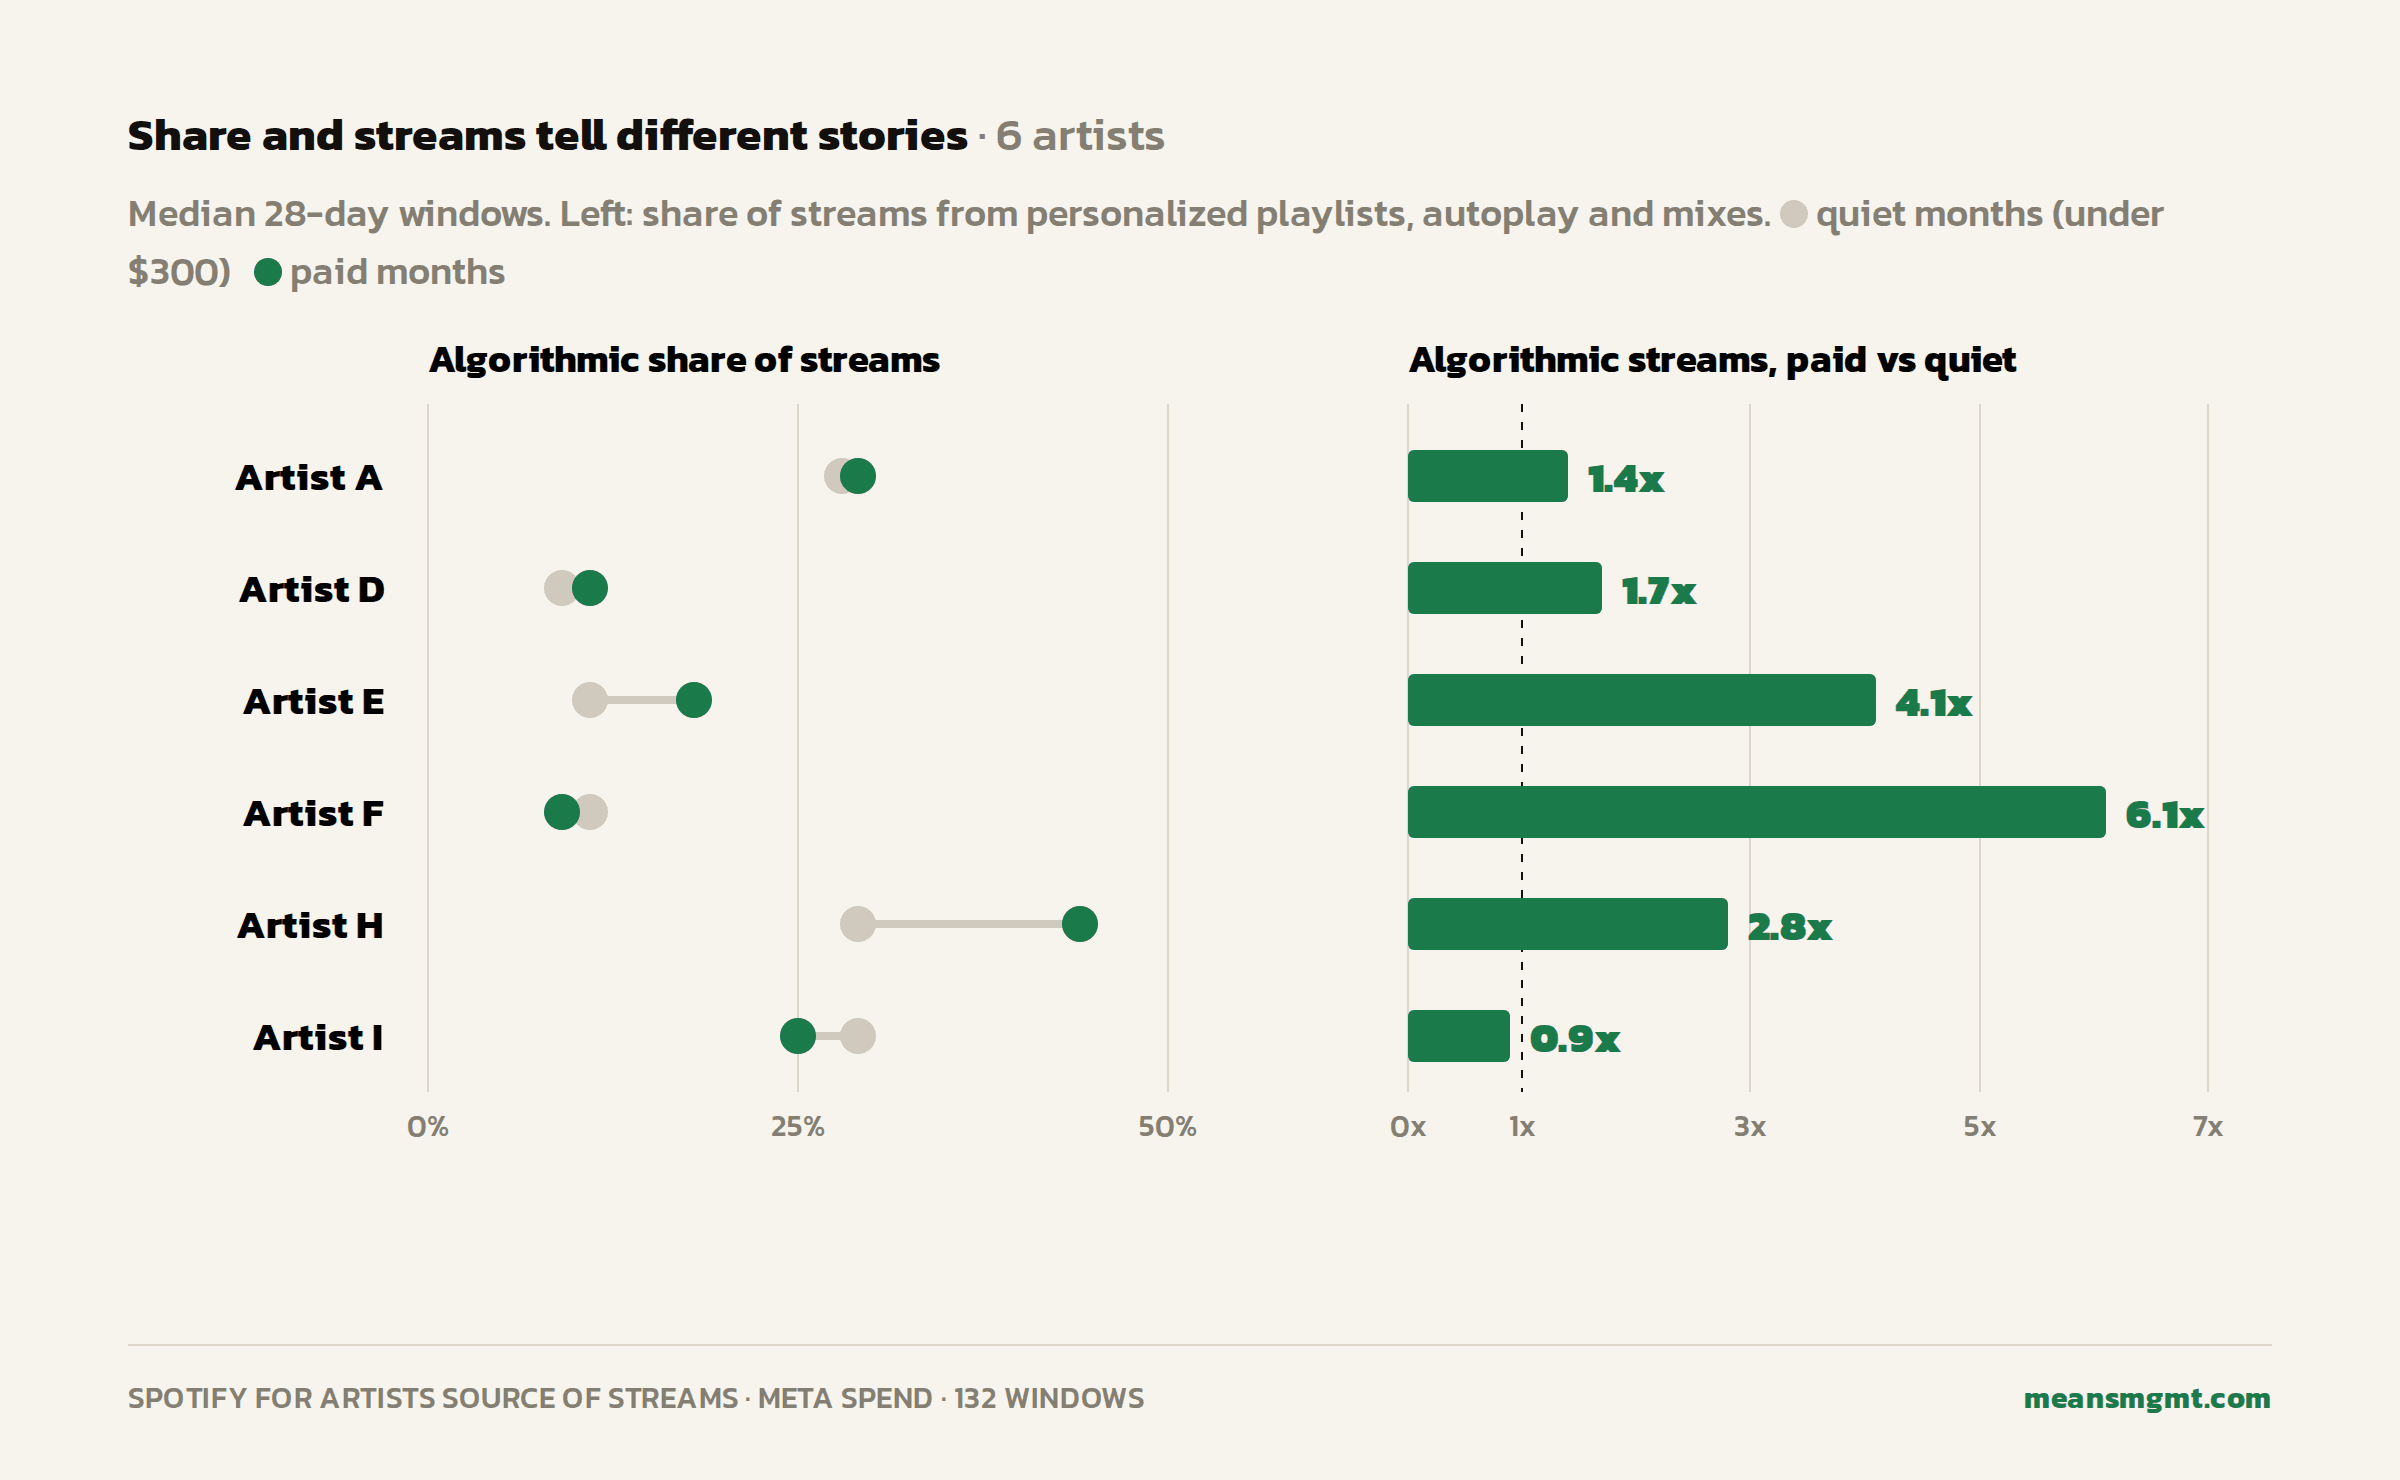
Algorithmic share against algorithmic streams, quiet months and paid months, six artists.
For Artist F, the share dropped two points in paid months while algorithmic streams ran 6.1 times higher. For Artist I, the share also dropped, and algorithmic streams were flat at 0.9 times. For Artist H, both went up.
The share on its own could not tell those three apart.
The stream count is the better number. Across all 132 windows, algorithmic streams rose and fell almost exactly in step with total streams (within-artist r = 0.87). When everything goes up together, the share stays flat even though the algorithm is sending more plays.
That still does not prove the ads fed the algorithm. Release Radar sits in the same row and serves every new release to your followers, ads or not. Of the 29 streaming pushes I could match to release dates, 11 started within a week of a release.
Playlist campaigns show the same trap. For Artist F, the share of streams from other listeners' playlists was lower in months with playlist spend than without (38% against 45%). The streams in that row were 5.9 times higher.
Save rate during a campaign measures who you bought
Save rate, saves divided by streams, is the other common check. During a campaign it mostly reflects the people the ads brought in.
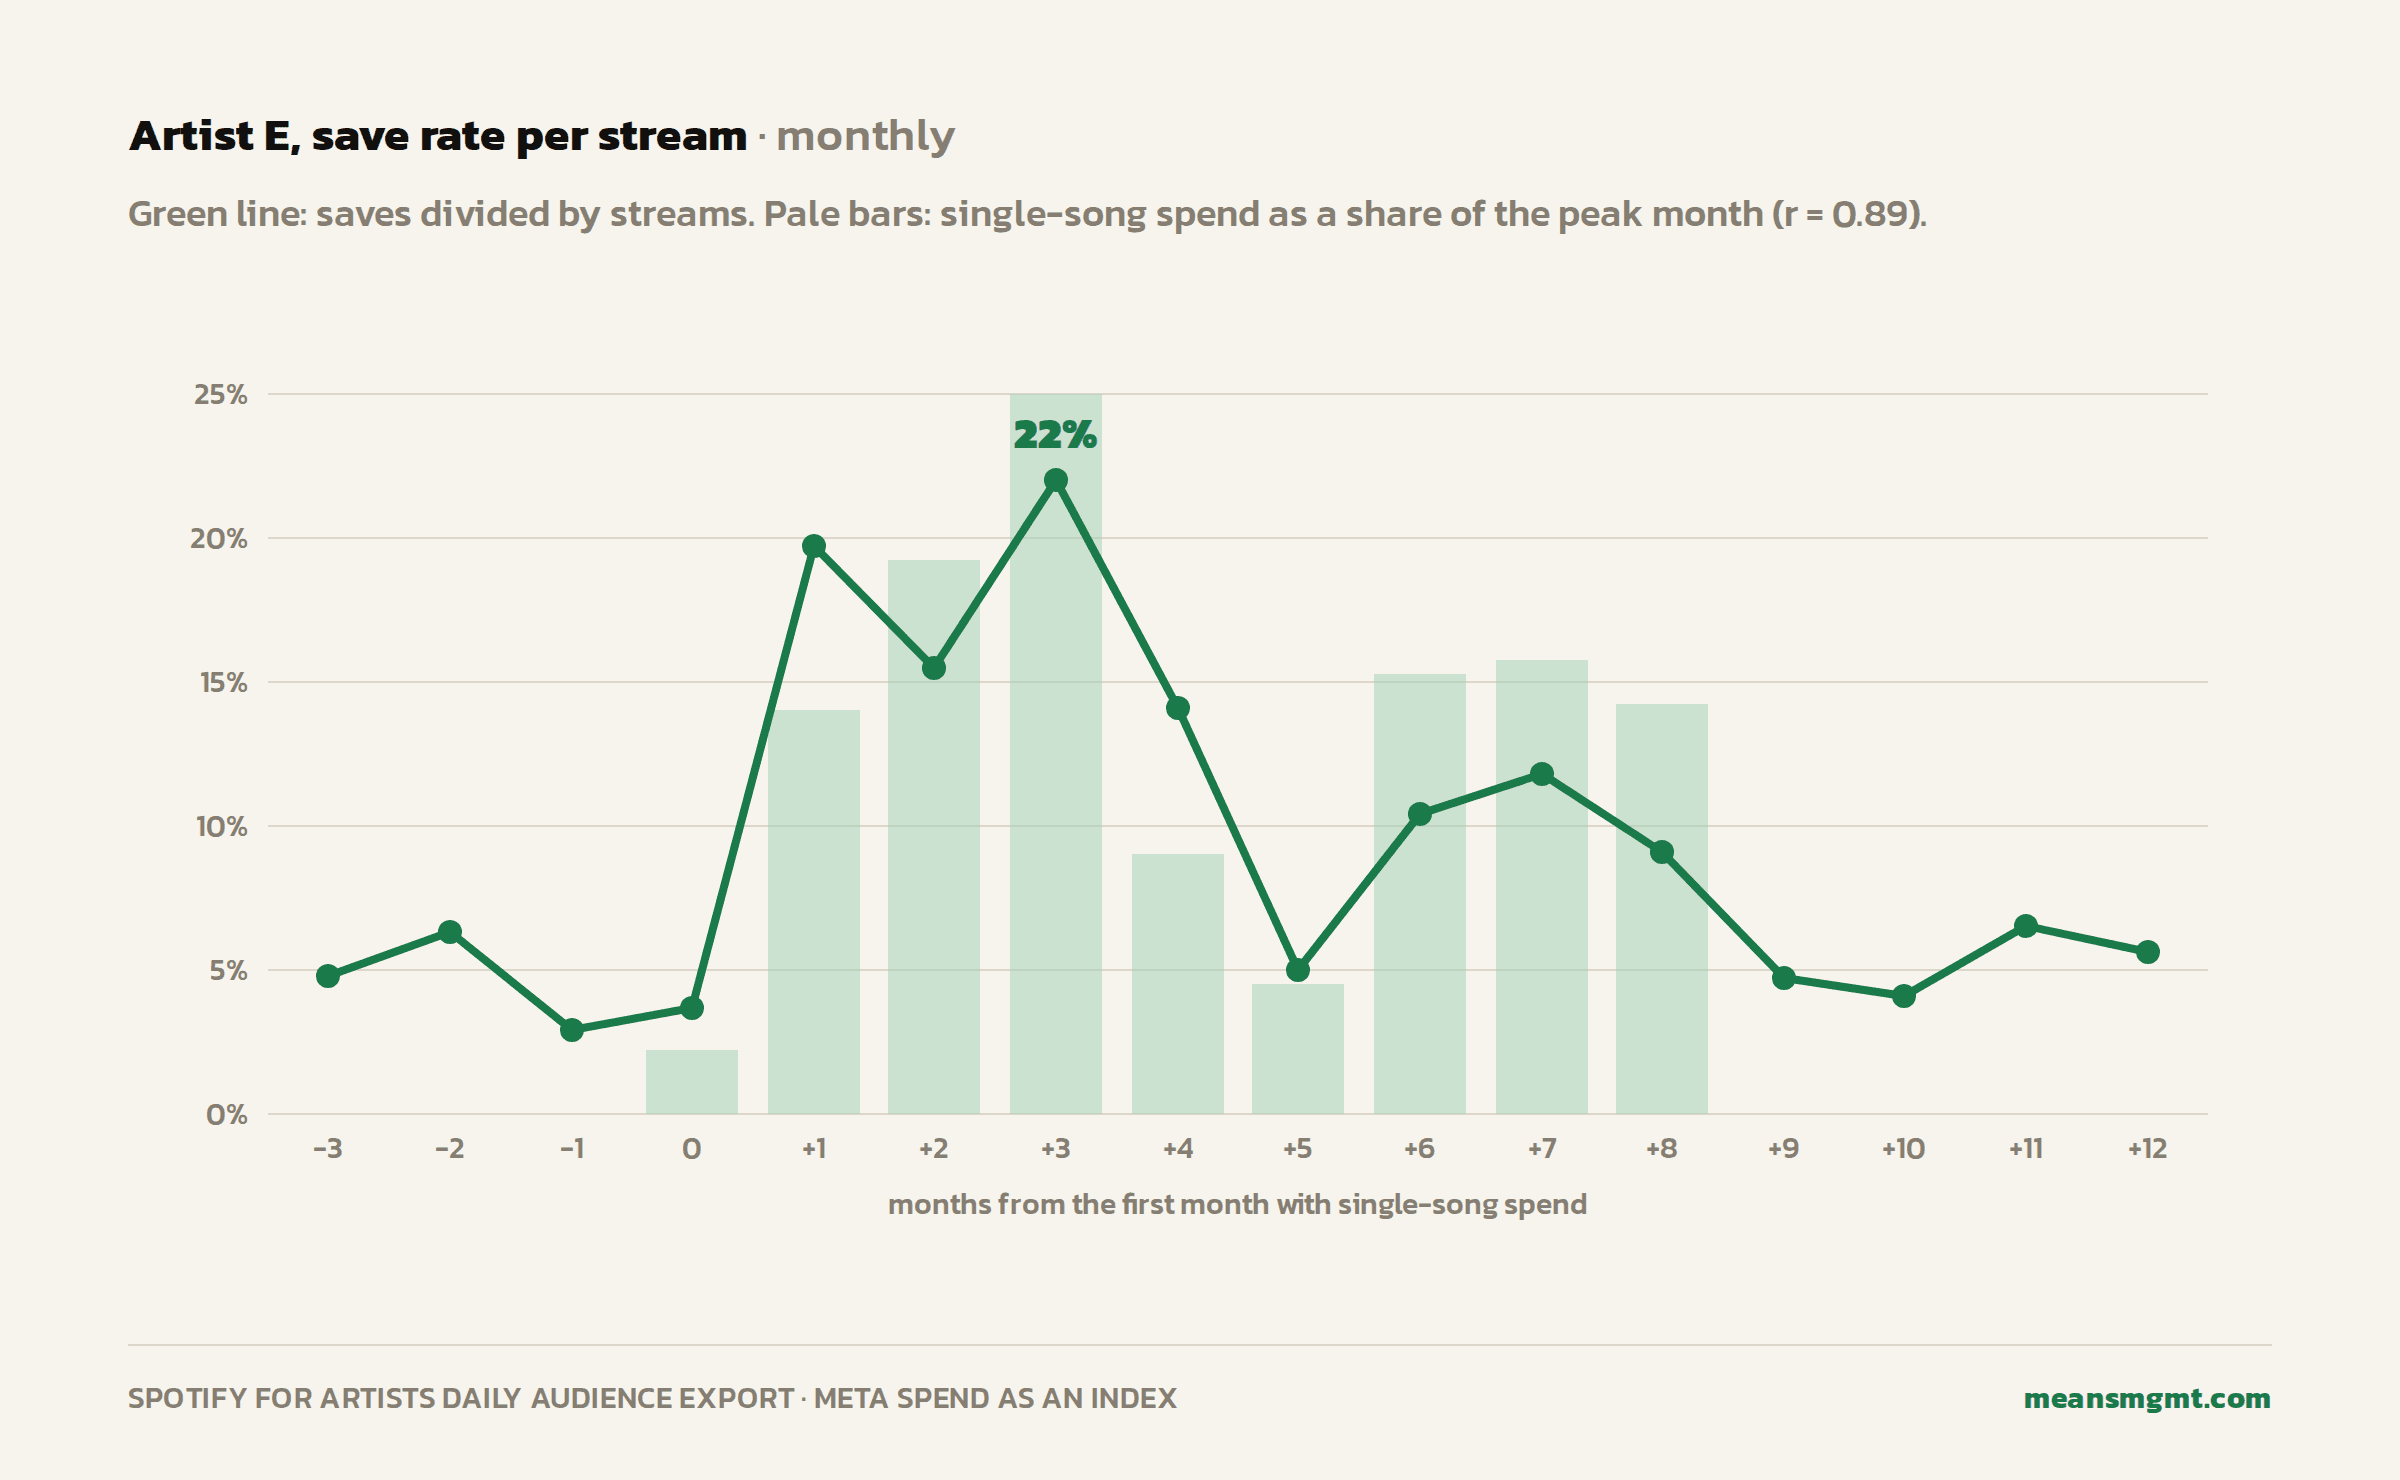
Artist E, monthly save rate per stream with single-song spend as an index, months counted from the first campaign month.
For Artist E, monthly save rate moved with single-song spend at r = 0.89. It ran 2.9% to 6.3% in the three months before the first campaign and 9.1% to 22% in the heavier-spend months. In the one month spend fell back it dropped to 5.0%, and since the last single-song campaign it has run 4.1% to 6.5%. Artists D (r = 0.77) and A (r = 0.75) followed spend the same way.
That is what you would expect from a paid audience. The people a streaming ad sends to Spotify have just chosen to hear the song, and a lot of them save it. Pre-saves turning into saves on release day push the number up too.
Neither really tells you much about how the song does with people who were not sent there.
The practical rule: compare save rate against your own months without spend, not against a benchmark, and do not judge a song from it mid-flight.
Streams rose during campaigns, by less than the case studies
For this dataset, we have 32 pushes across seven artists.
Pre-save, tour and awareness campaigns are left out, since they are not built to lift streams. For each push we compared daily streams during the flight with the 28 days before it.
The median push ran 1.14 times the level before it. 34% came in under the level before, and 5 of 32 doubled it.
Normal drift sets the bar, so we measured each artist against itself.
For four artists I could find 30-day stretches with no recorded Meta spend, in the stretch or the month before it. We used every such stretch inside the period our spend records cover, and measured them the same way.
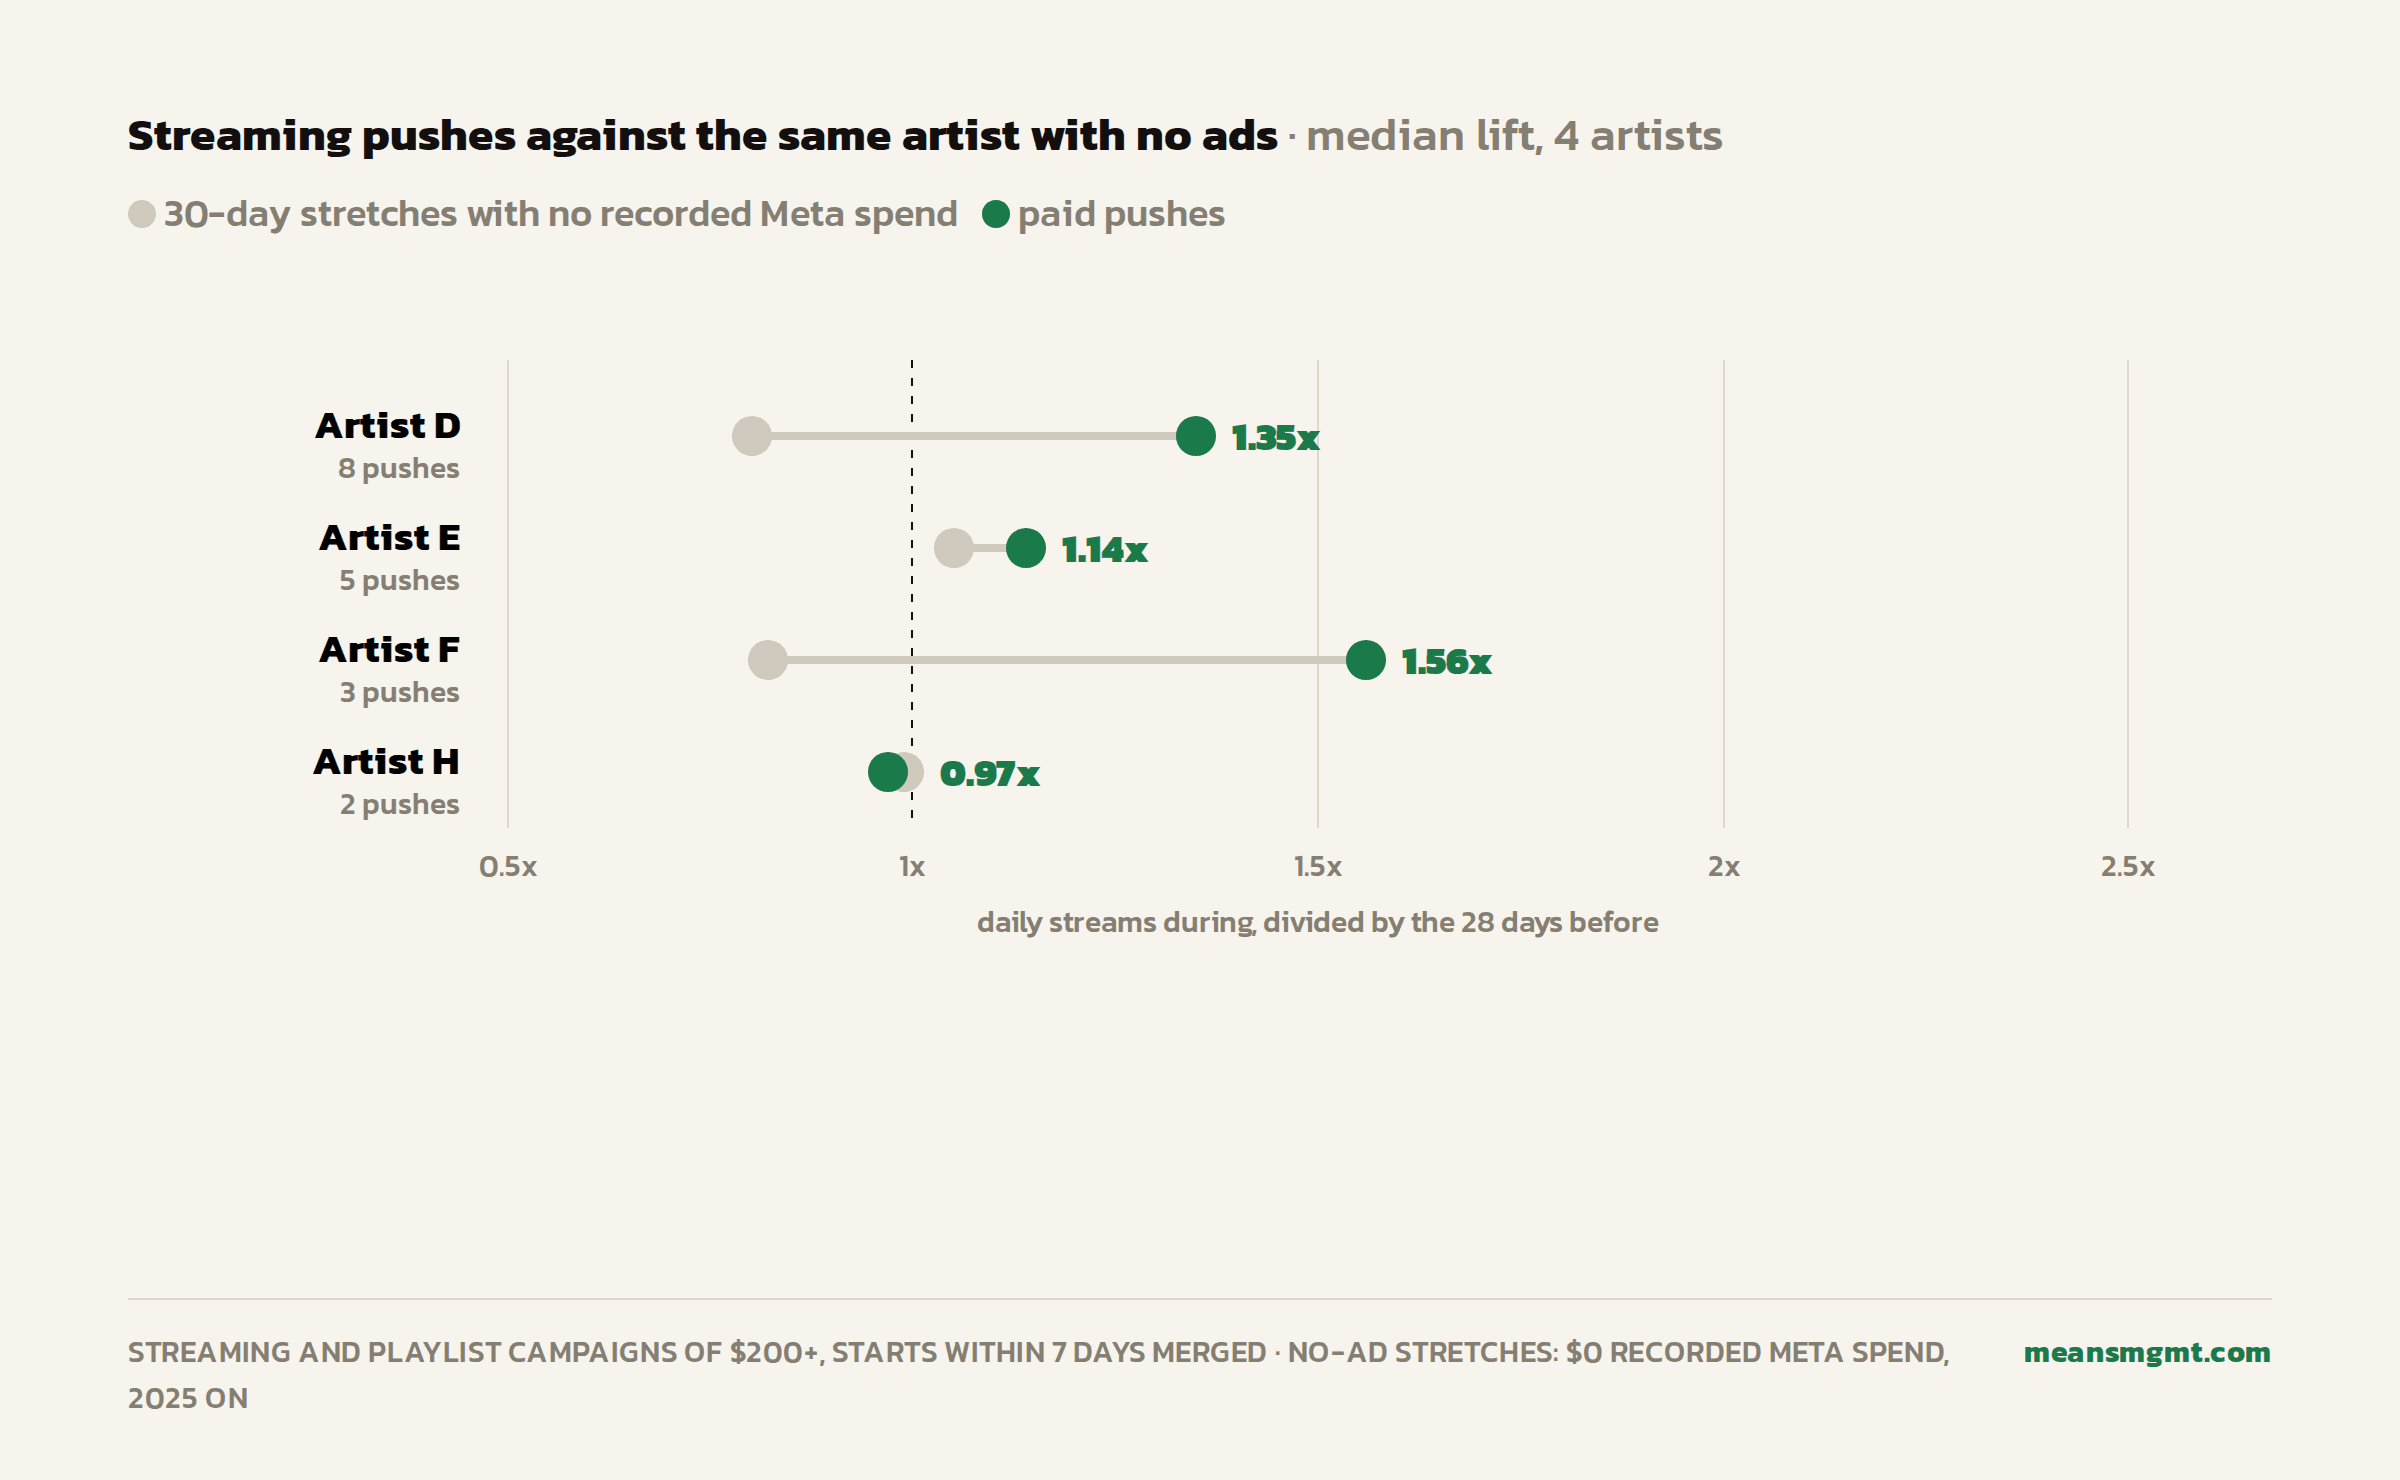
Median stream lift, streaming pushes against the same artist's stretches with no recorded Meta spend, four artists.
Pushes came out ahead of the same artist's ad-free stretches for three of the four artists, and a hair behind for the fourth, which had only two pushes. Ad-free stretches, weighted the same way, came in at 0.84 and fell below their own month before 72% of the time.
TikTok and YouTube spend is not in these records.
So streams rose during most streaming campaigns, by a modest amount on average, and more than the same artists drifted without ads.
The 2x and 4x stories happen, and they sit in the tail. Artists A and B never went a month without ads, and Artist I's quiet stretches all fall before our records begin.
Artists C and G are out of every spend comparison, because some of their campaigns ran in ad accounts I could not pull.
One campaign, switched off
Artist D gives the longest run of data after single-song spend ended. A playlist campaign kept running the whole time, and the first window after still had a little single-song spend, 11% of the window before.
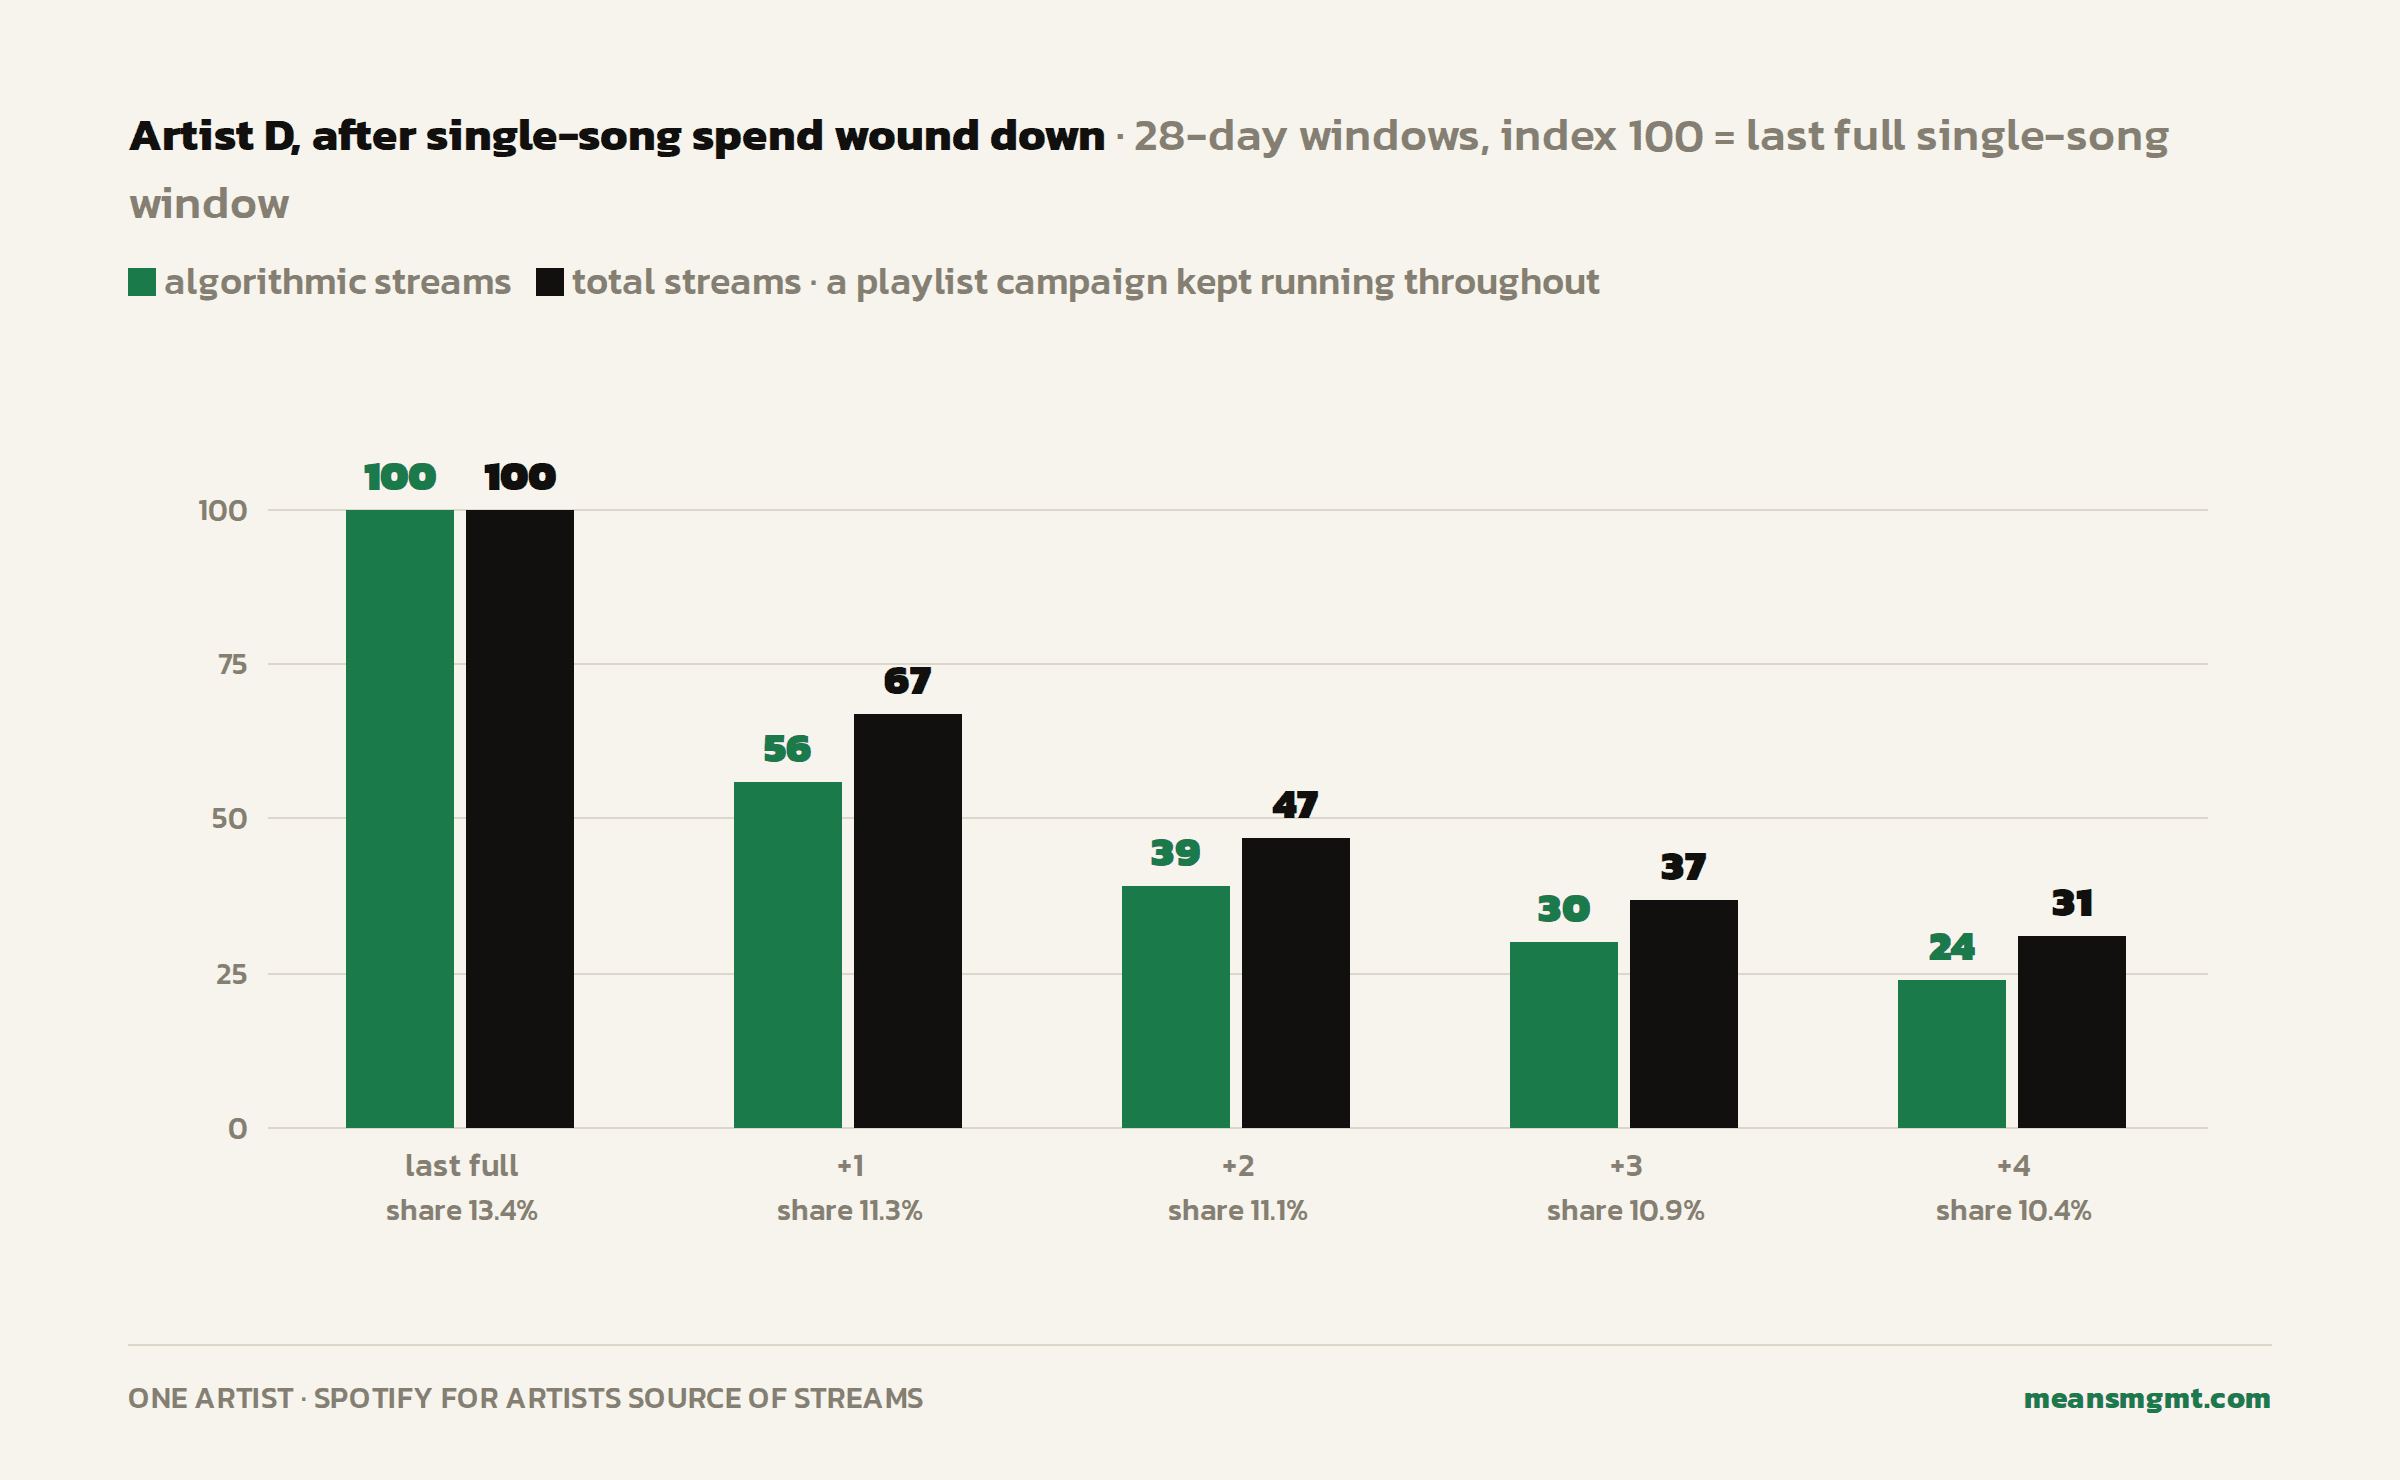
Artist D, algorithmic and total streams per 28-day window after single-song spend wound down, indexed to the last full single-song window.
Starting from the last full window of single-song spend, algorithmic streams fell to 56, 39, 30 and 24 on an index of 100. Total streams fell nearly in step, to 67, 47, 37 and 31. The algorithm's share only slid from 13.4% to 10.4%.
That decline is less telling than it looks. In an unpaid stretch the spring before, the same artist's total streams fell 25%, 27% and 20% a window. Four windows out, algorithmic streams were 8% above the artist's earliest window in the data.
This looks like a release cycle running down, and it says little about ads either way.
What this data can't answer
Whether a 20% save rate triggers the algorithm. Only 8 of 132 windows reached 20% saves per stream. With 132 windows, a correlation test only picks up relationships of about r = 0.24 or stronger. The claim is also about songs over 10 to 14 days, and this data is artists over 28 days.
Which campaign type is cheapest. Cost per follower, save or stream depends on genre, creative, country and objective. Our 2025 Global Music Streaming Advertising Report covers that spread by genre, market and audience.
Comparing a handful of artists against each other would mostly measure those differences.
Whether the ads caused any of it. There is no holdout here. Every comparison is the same artist with ads against without, and 11 of 29 streaming pushes started within a week of a release. The direction of a change is more trustworthy than its size.
Other things I could not control: playlist pitching, press, touring, sync, and paid channels outside Meta. Eleven of the 139 Meta campaigns were run by labels, not by us.
The rest were built by one agency with one set of habits.
Check your own numbers
You can run the useful version of this on your own account in about fifteen minutes.
In Spotify for Artists, open the source-of-streams view for a 28-day window that covers a campaign.
Write down the streams, not the percentage, for "personalized playlists, autoplay and mixes" and for the total.
Do the same for a 28-day window with no ads, ideally the one right before.
If algorithmic streams and total streams rose by about the same multiple, the campaign grew everything together. It did not change the mix.
Export the daily audience CSV and divide saves by streams for each month. Compare campaign months against months with no spend, not against someone else's benchmark.
For any campaign you want to judge, compare it to a stretch of the same length with no ads at all, not only to the month before.
If you have a catalog, a release calendar, and one region you could leave dark, we're happy to design a holdout test with you and publish what comes out.
FAQ
Questions we getIf you have a release coming, start with two quick questions, about three minutes in total, and we’ll scope your campaign. Want the numbers first? The benchmarks report is free.